The dataset in the below table represents the 4-month profits (in million $) of real estate company that operates in Egypt over the period of time between 2014-2018. I II III 2014 15.6 20.4 29.4 2015 13.8 23.2 35 2016 17.8 19.4 30.6 2017 21.4 24.8 33.6 2018 18.4 27.2 34.2 Answer the following questions: 1. Find the seasonal indices for the company’s profits and comment on the results. 2. Find the deseasonalized values of company’s profits and compare it to the actual values graphically. Comment on the results. 3. By using the deseasonalized values obtained in (2), determine the simple linear trend equation. And comment on the results. 4. Predict the expected value of company’s profit in summer 2019 which includes the effects of all the components of time series. And comment on the results


Question Four
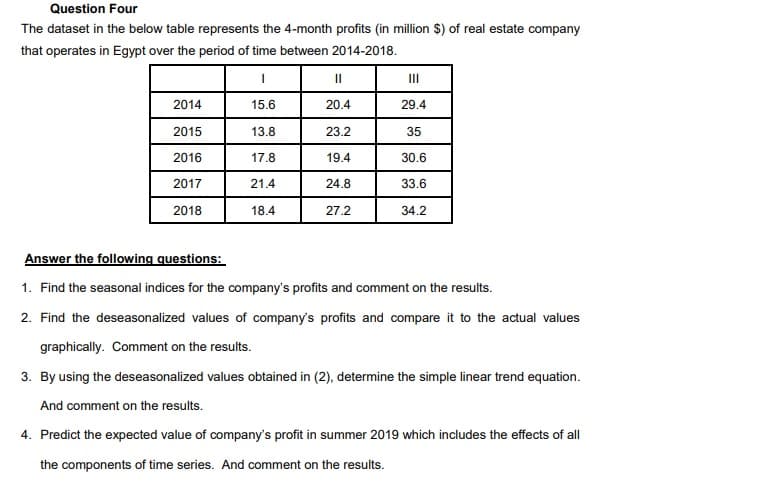
The dataset in the below table represents the 4-month profits (in million $) of real estate company
that operates in Egypt over the period of time between 2014-2018.
I II III
2014 15.6 20.4 29.4
2015 13.8 23.2 35
2016 17.8 19.4 30.6
2017 21.4 24.8 33.6
2018 18.4 27.2 34.2
Answer the following questions:
1. Find the seasonal indices for the company’s profits and comment on the results.
2. Find the deseasonalized values of company’s profits and compare it to the actual values
graphically. Comment on the results.
3. By using the deseasonalized values obtained in (2), determine the simple linear trend equation.
And comment on the results.
4. Predict the expected value of company’s profit in summer 2019 which includes the effects of all
the components of time series. And comment on the results

Step by step
Solved in 10 steps with 12 images
