Match the histograms shown to the summary statistics: Mean Median I 42 42 II 31 36 III 31 26 IV 31 32 15 10 15 25 35 45 55 -10 10 30 50 70 90 (a) (b) 10 15 10 5 -7.5 7.5 22.5 37.5 52.5 67.5 14 26 38 50 62 74 (d) (c) Frequency O 0070n4 210
Match the histograms shown to the summary statistics: Mean Median I 42 42 II 31 36 III 31 26 IV 31 32 15 10 15 25 35 45 55 -10 10 30 50 70 90 (a) (b) 10 15 10 5 -7.5 7.5 22.5 37.5 52.5 67.5 14 26 38 50 62 74 (d) (c) Frequency O 0070n4 210

Glencoe Algebra 1, Student Edition, 9780079039897, 0079039898, 2018
18th Edition
ISBN:9780079039897
Author:Carter
Publisher:Carter
Chapter10: Statistics
Section10.5: Comparing Sets Of Data
Problem 13PPS

Related questions

Topic Video
Question
please show all steps for this practice question
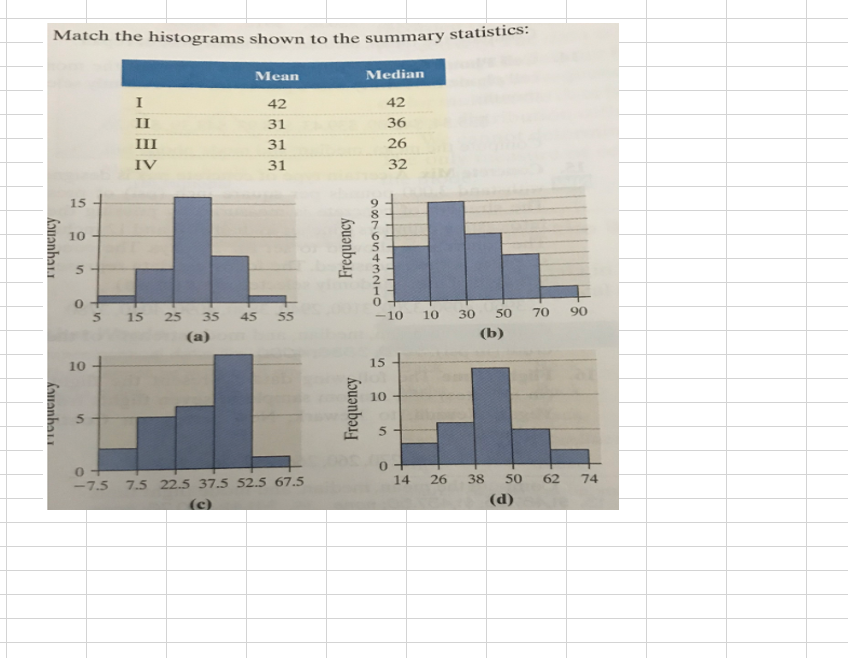
Transcribed Image Text:Match the histograms shown to the summary statistics:
Mean
Median
I
42
42
II
31
36
III
31
26
IV
31
32
15
10
15
25
35
45
55
-10
10
30
50
70
90
(a)
(b)
10
15
10
5
-7.5
7.5 22.5 37.5 52.5 67.5
14
38
50
62
74
(d)
(c)
26
O 0070n4 210
Frequency
Expert Solution
This question has been solved!
Explore an expertly crafted, step-by-step solution for a thorough understanding of key concepts.

This is a popular solution!

Trending now
This is a popular solution!

Step by step
Solved in 2 steps with 1 images

Knowledge Booster


Learn more about
Need a deep-dive on the concept behind this application? Look no further. Learn more about this topic, statistics and related others by exploring similar questions and additional content below.Recommended textbooks for you
Glencoe Algebra 1, Student Edition, 9780079039897…
Algebra
ISBN:
9780079039897
Author:
Carter
Publisher:
McGraw Hill
Glencoe Algebra 1, Student Edition, 9780079039897…
Algebra
ISBN:
9780079039897
Author:
Carter
Publisher:
McGraw Hill