F COMPREHE ENDED 31 D


Q: Using these data from the comparative balance sheet of Ivanhoe Company, perform horizontal analysis.…
A: For the given data, we need to calculate increase/ decrease in assets & percentage of changes.
Q: 5. For common-size statement of comprehensive income , _______________ is set 100% a. Net Sales b.…
A: Common size statement shows vertical analysis of the items of financial statements with respect to…
Q: Required: Compute the following: (1) current ratio, (2) acid-test ratio, (3) days' sales…
A: Common stock: These are the shares issued by a company to an outsider. These shares entitle a share…
Q: The major components of the income statement are listed below: A= extraordinary items B = income…
A: Income Statement format containing major components as shown above: Income from Continuing…
Q: Assume you are given the following relationships for the Clayton Corporation: Sales/total assets…
A: Given the following information: Sales/total assets: 1.5 Return on assets (ROA): 3% Return on…
Q: I Current ratio li. Times interest earned jli. Inventory turnover
A: Current Ratio: It is a measure of a firm's liquidity and shows the firm's ability to repay its…
Q: Using the da
A: Common size income statement analyse every item of income statement as a percentage of sales. This…
Q: Required: Compute the following: (For Requirements 1 to 4, enter your percentage answers rounded to…
A: As per Bartleby Honor Code, when a question with multiple sub-parts has been asked, the expert is…
Q: Define each of the following terms:a. Liquid assetb. Liquidity ratios: current ratio; quick (acid…
A: Hey, since there are multiple questions posted, we will answer the first question. If you want any…
Q: Calculate the following ratios: 1. Return on Capital Employed (ROCE) 2. Current Ratio 3. Gearing…
A: 1.Return on Capital Employed (ROCE) Return on capital employed is calculated by dividing net…
Q: For both the Current Year and 1 Year Agocompute the following ratios: (3-a) Return on total assets.…
A: Return on Asset = Net Income/Total Assets
Q: Assuming the following information, what is the (simplified) Internal Growth Ratio (express in…
A: Answer) Calculation of Internal Growth Ratio Internal growth ratio = (Return on Assets X Retention…
Q: a) What is the net income of Liberty Company for the current year? b) How much is the comprehensive…
A: Net income of Liberty Company for the current year: Sales P9,750,000 Interest revenue 18,000 Gain on…
Q: O Question 30 The major components of the income statement are listed below: A = results from…
A: The question is multiple choice question. Required Choose the Correct Option.
Q: Lin horizontal aant anal ysis, eash item is expressed as a Percentage of the (a) net inconr amounb.…
A: Horizontal analysis is carried out with a view to show the changes in values of financial statement…
Q: Required: 1. Express each year's income statement in common-size percentages. (R
A:
Q: Case 1: Vertical Analysis of Profit and Loss Prepare a vertical analysis of the income statements of…
A: Answer: As per Q/A guidelines, only first 3 sub parts to be answered. Please repost remaining…
Q: this would represent an example of what type of analysis:
A: Financial statements: It refers to the end reports prepared by n organization to report the…
Q: $1.136 Calculate the following ratios: Current ratio Times interest earned Inventory turnover Total…
A: calculation of current ratio, time interest ratio, inventory turnover ratio, total assets turnover…
Q: 1. Prepare comparative balance sheets for 20 x 2 and 20 x 1, showing peso and percentage increases…
A: As per our protocol we provide solution to the one question only or if in parts then to the first…
Q: a. Prepare a vertical analysis of Midnight Enterprises' income statements. If required, round…
A: Solution:- a)Preparation of Vertical analysis as follows under:- Note:- Income statement vertical…
Q: Define profitability raitos return on assets and return on equity. According to the following…
A: Return on assets (ROA) is computed by dividing net income by total assets: Return on equity (ROE)…
Q: a. Calculate a measure of times-interest-earned for the industry. b. Calculate a measure of…
A: Answer a. Times interest earned = EBITDA of all companiestotal of interest expense of all companies…
Q: When vertical analysis is applied to the income statement of a business with a net sales of TL…
A: The income statement is the most important financial document issued by a business entity. This…
Q: Compute the component percentages for Trixy Magic’s income statement below. (Enter your answers as a…
A: The percentage of sales is calculated by dividing the concern value by the sales and multiplying it…
Q: Q1. On a multiple-step income statement, the excess of sales over the cost of goods sold is called:…
A: A Multiple-Step Income Statement is an Income Statement which categorize income and expenses into…
Q: 4-10)Assume the following relationships for Brauer Corp.: Sales/Total Assets 1.5X Return on Assets…
A: A quantitative method that provides information about the company including its liquidity,…
Q: Instructions: Compute the following ratios for 2016 with interpretation a) Current ratio. b)…
A: Current ratio is calculated by dividing the current assets with the current liabilities. This ratio…
Q: Long-term solvency is indicated by a. Current ratio b. Debt/equity ratio c. Operating ratio d. Net…
A: Solvency refers to the company's ability to repay it's debt
Q: a) Prepare a projected income statement for the year to 31 October Year 8. b) Calculate for Year 7…
A: Note: Since we only answer up to 3 sub-parts, we’ll answer the first 3. Please resubmit the question…
Q: Given a profit margin = 15%, ROE = 25%, D/E = 1.25, and assets = $600, please calculate sales.
A: First step is to compute the equity and on finding the equity amount, the net income shall be…
Q: Question 51: In the vertical analysis of an income statement, what is the base (100%) figure?…
A: Vertical analysis of income statement means where all items of a particular period of income…
Q: The ratio is the best overall measure of management's performance O a. Activity ratio b. Debt-equity…
A: Operating Efficiency Ratio- Operating Profit Margin/ Operating Efficiency ratio refers to the ratio…
Q: Match each ratio that follows to its use. Items may be used more than once. Clear All…
A: Ratio analysis: It refers to the quantitative technique of financial analysis that allows gaining an…
Q: he ratio percentage of earnings retained is the same as that termed : A- dividend yield B-…
A: Dividend yield means the ratio of dividend to market price per share. Dividend payout means ratio of…
Q: a. Prepare a vertical analysls percents as whole numbers. Versatile Company Income Statements For…
A: Vertical analysis: Vertical analysis is the method of financial statement analysis, and it is…
Q: 31. The return on total assets is computed by dividing A) Net sales by ending total assets. B) Net…
A: Return on Total Assets: Return on total assets is a ratio that is used to measure a company’s…
Q: mpute the consolidated gain or loss on a lidated income statement for at the end 20
A: The main objective of the income statement is to show how much gain or loss an organization…
Q: Question 1 For each company, calculate the following ratios: · Use the formula sheet provided. · You…
A: 1. Gross profit percentage = Gross profit/ Sales 2.Return on capital employed = Net profit/…
Q: BASELINE ACTIVITY 1 Classify the given financial indicators in the table below (see the example…
A: Profitability ratios are the ratios that indicate the ability of the company to generate profit by…
Q: Required a) Using the above information, calculate the following ratios to one (1) decimal place:…
A: Hi student Since there are multiple subparts, we will answer only first three subparts.
Q: 27-A prepare the following: GROSS PROFIT RATIO PROFIT MARGIN RETURN ON ASSETS EARNINGS PER SHARE…
A: Financial ratios are calculated by taking relevant information from the prepared financial…
Q: Find the below following: Gross Profit Ratio Operating Ratio Net Profit Ratio Operating (Net) Profit…
A: as per Bartleby guidelines when multiple subparts asked for one single question we can answer 1st 3…
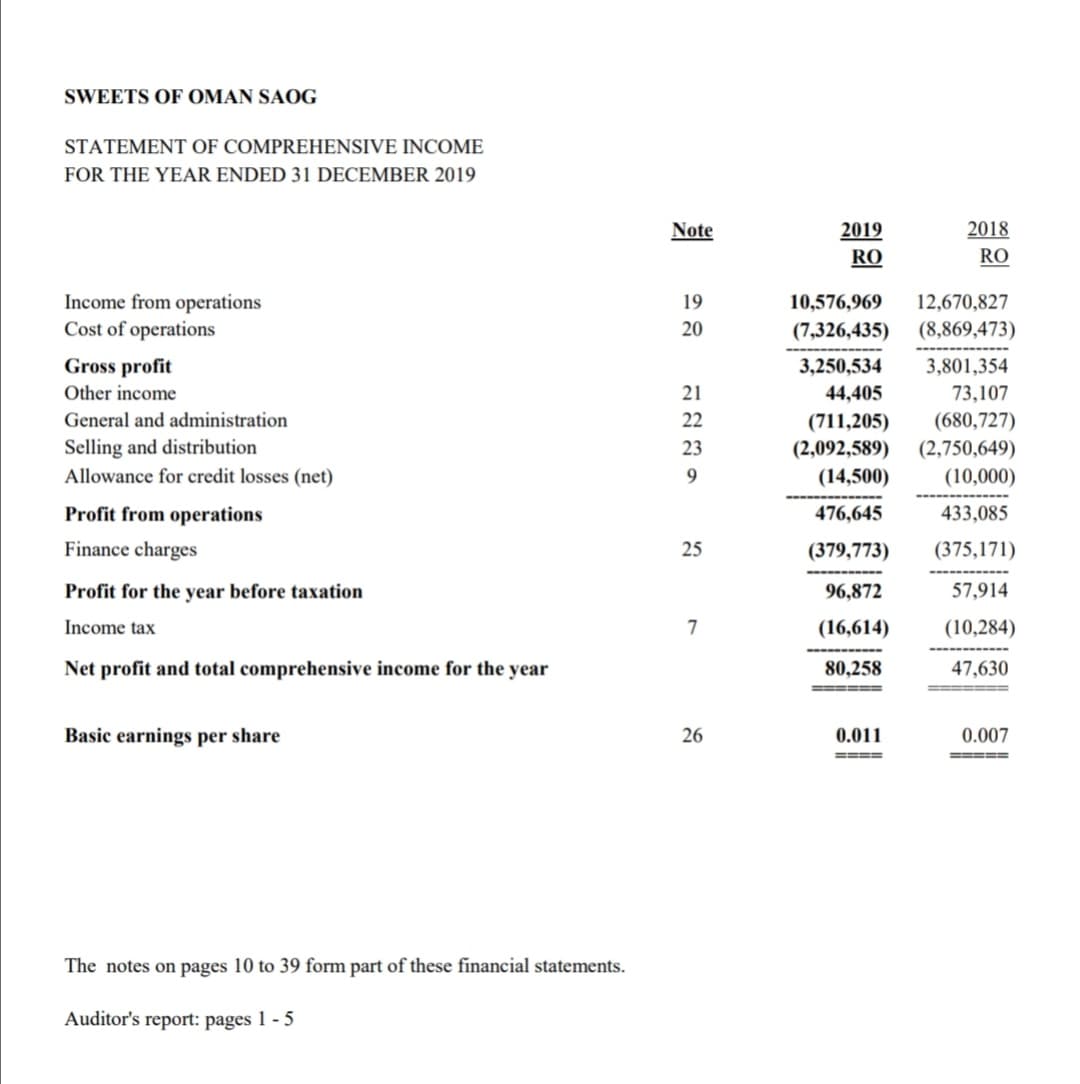
Solve this Income statement by Vertical analysis:

Step by step
Solved in 2 steps


- tion 8Income statement for the year ended 31 December, 2019 of KKMTN Ghana Ltd2018 2019ȼ ‘000 ȼ ‘000Turnover 420,000 523,600Cost of sales (330,000) (417,200)Gross profit 89,000 106,400Expenses:Administration 44,600 50,200Selling and distribution 15,400 (60,000) 19,600 (69,800)Profit before interest 29,000 36,600Debenture interest - (2,800)Net profit before tax 29,000 33,800Taxation (8,000) (10,000)Net Profit after tax 21,000 23,800Ordinary dividend paid 8,400 9,250Ordinary shares issued 12 million and trading at ȼ3 each as at yesterday onGSE.You are required to compute the following investment ratios:a). Earnings per shareb). Dividend per sharec). Payout ratiod). Price earnings ratioe). Earnings yieldCALCULATE THE EBITDA For the year ended December 31, Notes 2020 2019 Revenue ₱ 10,775,731.00 ₱ 11,334,976.00 Cost of Sales 7,175,540.00 7,552,700.00 Gross profit 3,600,191.00 3,782,276.00 General and Administrative expenses 3,278,202.00 3,417,740.00 Finance Cost Or Interest Expense 48,000.00 16,000.00 Net Income before Tax 273,989.00 348,536.00 Provision for Income Tax 82,197.00 104,561.00 NET INCOME AFTER TAX ₱ 191,792.00 ₱ 243,975.00 (See Notes to Financial Statement)STATEMENT OF COMPREHENSIVE INCOME FOR THE YEAR ENDED DECEMBER 31 2020 2019 2018 Turnover 373,578 424,486 456,300 Cost of sales (253,604) (254,210) (198,900) Gross profit 119,974 170,276 257,400 Impairment of financial assets (2,477) (1,800) (5,400) Distribution costs (87,036) (91,309) (96,100) Administrative expenses (32,556) (50,656) (67,200) Other operating income 2,369 10,039 3,500 Operating profit 274 36,550 92,200 Finance income 2,594 4,949 7,200 Finance costs (2,069) (2,765) (3,400) Profit before income tax 799 38,734 96,000 Income tax expense (285) (13,718) (15,450) Profit for the year 514 25,016 80,550 Other comprehensive income - - - Total comprehensive income 514 25,016 80,550 Table 1 Source (Author, 2022) CLOUD 9 LTD STATEMENT OF FINANCIAL POSITION AS AT DECEMBER 31 Non-current…
- Selected comparative financial statements of Korbin Company follow. KORBIN COMPANY Comparative Income Statements For Years Ended December 31 2021 2020 2019 Sales $ 508,246 $ 389,358 $ 270,200 Cost of goods sold 305,964 246,853 172,928 Gross profit 202,282 142,505 97,272 Selling expenses 72,171 53,731 35,666 Administrative expenses 45,742 34,264 22,427 Total expenses 117,913 87,995 58,093 Income before taxes 84,369 54,510 39,179 Income tax expense 15,693 11,175 7,953 Net income $ 68,676 $ 43,335 $ 31,226 KORBIN COMPANY Comparative Balance Sheets December 31 2021 2020 2019 Assets Current assets $ 60,248 $ 40,324 $ 53,904 Long-term investments 0 1,000 3,350 Plant assets, net 113,627 103,113 62,412 Total assets $ 173,875 $ 144,437 $ 119,666 Liabilities and Equity Current liabilities $ 25,386 $ 21,521 $ 20,942 Common stock 66,000 66,000 48,000 Other paid-in capital 8,250 8,250 5,333 Retained earnings 74,239 48,666…Selected comparative financial statements of Korbin Company follow. KORBIN COMPANY Comparative Income Statements For Years Ended December 31 2021 2020 2019 Sales $ 508,246 $ 389,358 $ 270,200 Cost of goods sold 305,964 246,853 172,928 Gross profit 202,282 142,505 97,272 Selling expenses 72,171 53,731 35,666 Administrative expenses 45,742 34,264 22,427 Total expenses 117,913 87,995 58,093 Income before taxes 84,369 54,510 39,179 Income tax expense 15,693 11,175 7,953 Net income $ 68,676 $ 43,335 $ 31,226 KORBIN COMPANY Comparative Balance Sheets December 31 2021 2020 2019 Assets Current assets $ 60,248 $ 40,324 $ 53,904 Long-term investments 0 1,000 3,350 Plant assets, net 113,627 103,113 62,412 Total assets $ 173,875 $ 144,437 $ 119,666 Liabilities and Equity Current liabilities $ 25,386 $ 21,521 $ 20,942 Common stock 66,000 66,000 48,000 Other paid-in capital 8,250 8,250 5,333 Retained earnings 74,239 48,666…Selected comparative financial statements of Korbin Company follow. KORBIN COMPANY Comparative Income Statements For Years Ended December 31 2021 2020 2019 Sales $ 508,246 $ 389,358 $ 270,200 Cost of goods sold 305,964 246,853 172,928 Gross profit 202,282 142,505 97,272 Selling expenses 72,171 53,731 35,666 Administrative expenses 45,742 34,264 22,427 Total expenses 117,913 87,995 58,093 Income before taxes 84,369 54,510 39,179 Income tax expense 15,693 11,175 7,953 Net income $ 68,676 $ 43,335 $ 31,226 KORBIN COMPANY Comparative Balance Sheets December 31 2021 2020 2019 Assets Current assets $ 60,248 $ 40,324 $ 53,904 Long-term investments 0 1,000 3,350 Plant assets, net 113,627 103,113 62,412 Total assets $ 173,875 $ 144,437 $ 119,666 Liabilities and Equity Current liabilities $ 25,386 $ 21,521 $ 20,942 Common stock 66,000 66,000 48,000 Other paid-in capital 8,250 8,250 5,333 Retained earnings 74,239 48,666…
- Extract of statement of Income and Expenditure for the Financial Years Ended 31 August 2020 2020 (RM) 2019 (RM) 2018 (RM) Investment Income 45,335,069 13,237,244 19,474,895 Expenses -6,039,755 -2,270,688 -1,853,602 Net Income before taxation 39,295,314 10,966,556 14,621,293 Net Income after taxation 39,335,238 10,953,497 17,551,931 Extract of statement of Asset and Liabilities as at 31 August 2020 2020(RM) 2019 (RM) 2018 (RM) Total Investments 501,519,061 154,032,209 84,711,928 Other Assets 6,732,463 9,085,056 3,173,994 Total Assets 508,251,524 163,117,265 87,885,922 Total Liabilities -3,411,047 -2,276,421 -255,684 Number of Unit in Circulation 500,000,000 500,000,000 500,000,000 NAV/Unit Holder’s Capital per share Based on the historical financial highlights extracted of statement of income and expenditure, calculate the Net Asset Value (NAV) per share of the respective funds?Extract of statement of Income and Expenditure for the Financial Years Ended 31 August 2020 2020 (RM) 2019 (RM) 2018 (RM) Investment Income 45,335,069 13,237,244 19,474,895 Expenses -6,039,755 -2,270,688 -1,853,602 Net Income before taxation 39,295,314 10,966,556 14,621,293 Net Income after taxation 39,335,238 10,953,497 17,551,931 Extract of statement of Asset and Liabilities as at 31 August 2020 2020(RM) 2019 (RM) 2018 (RM) Total Investments 501,519,061 154,032,209 84,711,928 Other Assets 6,732,463 9,085,056 3,173,994 Total Assets 508,251,524 163,117,265 87,885,922 Total Liabilities -3,411,047 -2,276,421 -255,684 Number of Unit in Circulation 500,000,000 500,000,000 500,000,000 NAV/Unit Holder’s Capital per shareSelected comparative financial statements of Korbin Company follow. KORBIN COMPANY Comparative Income Statements For Years Ended December 31 2021 2020 2019 Sales $ 510,880 $ 391,376 $ 271,600 Cost of goods sold 307,550 248,524 173,824 Gross profit 203,330 142,852 97,776 Selling expenses 72,545 54,010 35,851 Administrative expenses 45,979 34,441 22,543 Total expenses 118,524 88,451 58,394 Income before taxes 84,806 54,401 39,382 Income tax expense 15,774 11,152 7,995 Net income $ 69,032 $ 43,249 $ 31,387 KORBIN COMPANY Comparative Balance Sheets December 31 2021 2020 2019 Assets Current assets $ 53,905 $ 36,079 $ 48,229 Long-term investments 0 500 3,040 Plant assets, net 101,665 92,652 55,799 Total assets $ 155,570 $ 129,231 $ 107,068 Liabilities and Equity Current liabilities $ 22,713 $ 19,255 $ 18,737 Common stock 68,000 68,000 50,000 Other paid-in capital 8,500 8,500 5,556 Retained earnings 56,357 33,476…
- X Company collected P12350 in interest during 2019 X showed P1,850 in interest on its December 31, 2021 statement of financial position and P5,300 on December 31, 2020 How much is the Interest Revenue to be reported on X's statement of comprehensive income in 2021?Selected comparative financial statements of Korbin Company follow. KORBIN COMPANY Comparative Income Statements For Years Ended December 31 2021 2020 2019 Sales $ 429,809 $ 329,269 $ 228,500 Cost of goods sold 258,745 207,439 146,240 Gross profit 171,064 121,830 82,260 Selling expenses 61,033 45,439 30,162 Administrative expenses 38,683 28,976 18,966 Total expenses 99,716 74,415 49,128 Income before taxes 71,348 47,415 33,132 Income tax expense 13,271 9,720 6,726 Net income $ 58,077 $ 37,695 $ 26,406 KORBIN COMPANY Comparative Balance Sheets December 31 2021 2020 2019 Assets Current assets $ 58,039 $ 38,846 $ 51,928 Long-term investments 0 1,100 3,100 Plant assets, net 106,146 96,441 57,969 Total assets $ 164,185 $ 136,387 $ 112,997 Liabilities and Equity Current liabilities $ 23,971 $ 20,322 $ 19,774 Common stock 67,000 67,000 49,000 Other paid-in capital 8,375 8,375 5,444 Retained earnings 64,839 40,690 38,779 Total liabilities and equity $ 164,185 $ 136,387 $…HIC GROUP OF Companies COMPARATIVE INCOME STATEMENT For years ended 3rd December 2019 2020 Revenue and gains Sales revenue 495,500 496,738.75 Interest revenue 278,500 279,196.25 Investment Income 71,700 71,879.25 Other revenue 101,500 101,753.75 Total revenue and gains 947,200 949,968 Expenses and losses Cost of good sold 450,000 447,750 Selling&administrative 185,000 184,075 Computer (operating) 42,500 42,288…