f. The equation of the linear regression line is: ŷ = (Please show your answers to two decimal places) g. Use the model to predict the amount of money spent by a customer who spends 20 minutes at the store. Dollars spent = (Please round your answer to the nearest whole number.)
f. The equation of the linear regression line is: ŷ = (Please show your answers to two decimal places) g. Use the model to predict the amount of money spent by a customer who spends 20 minutes at the store. Dollars spent = (Please round your answer to the nearest whole number.)

Glencoe Algebra 1, Student Edition, 9780079039897, 0079039898, 2018
18th Edition
ISBN:9780079039897
Author:Carter
Publisher:Carter
Chapter4: Equations Of Linear Functions
Section4.5: Correlation And Causation
Problem 2CYU

Related questions
Question
Please solve f-g
Transcribed Image Text:● Question 12
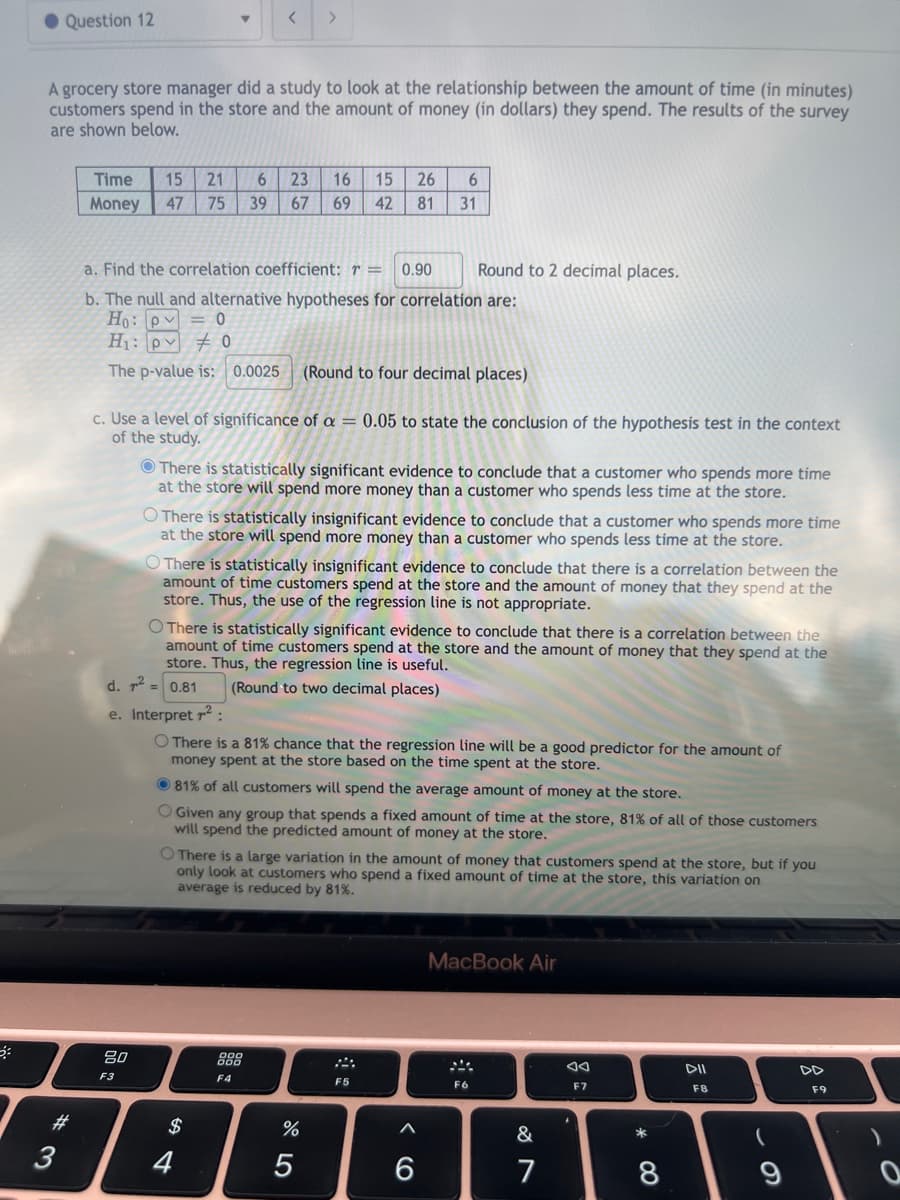
A grocery store manager did a study to look at the relationship between the amount of time (in minutes)
customers spend in the store and the amount of money (in dollars) they spend. The results of the survey
are shown below.
# 3
Time 15 21 6 23 16 15 26 6
Money 47 75 39 67 69 42 81
31
< >
a. Find the correlation coefficient: r = 0.90
b. The null and alternative hypotheses for correlation are:
Ho: P = 0
H₁: p0
The p-value is: 0.0025 (Round to four decimal places)
c. Use a level of significance of a = 0.05 to state the conclusion of the hypothesis test in the context
of the study.
80
F3
There is statistically significant evidence to conclude that a customer who spends more time
at the store will spend more money than a customer who spends less time at the store.
O There is statistically insignificant evidence to conclude that a customer who spends more time
at the store will spend more money than a customer who spends less time at the store.
O There is statistically insignificant evidence to conclude that there is a correlation between the
amount of time customers spend at the store and the amount of money that they spend at the
store. Thus, the use of the regression line is not appropriate.
O There is statistically significant evidence to conclude that there is a correlation between the
amount of time customers spend at the store and the amount of money that they spend at the
store. Thus, the regression line is useful.
d. ² = 0.81
(Round to two decimal places)
e. Interpret ²:
There is a 81% chance that the regression line will be a good predictor for the amount of
money spent at the store based on the time spent at the store.
81% of all customers will spend the average amount of money at the store.
O Given any group that spends a fixed amount of time at the store, 81% of all of those customers
will spend the predicted amount of money at the store.
$
Round to 2 decimal places.
O There is a large variation in the amount of money that customers spend at the store, but if you
only look at customers who spend a fixed amount of time at the store, this variation on
average is reduced by 81%.
4
F4
%
5
F5
6
MacBook Air
F6
&
7
AA
F7
* 00
8
DII
F8
(
9
F9
0
Transcribed Image Text:store. Thus, the use of the regression line is not appropriate.
O There is statistically significant evidence to conclude that there is a correlation between the
amount of time customers spend at the store and the amount of money that they spend at the
store. Thus, the regression line is useful.
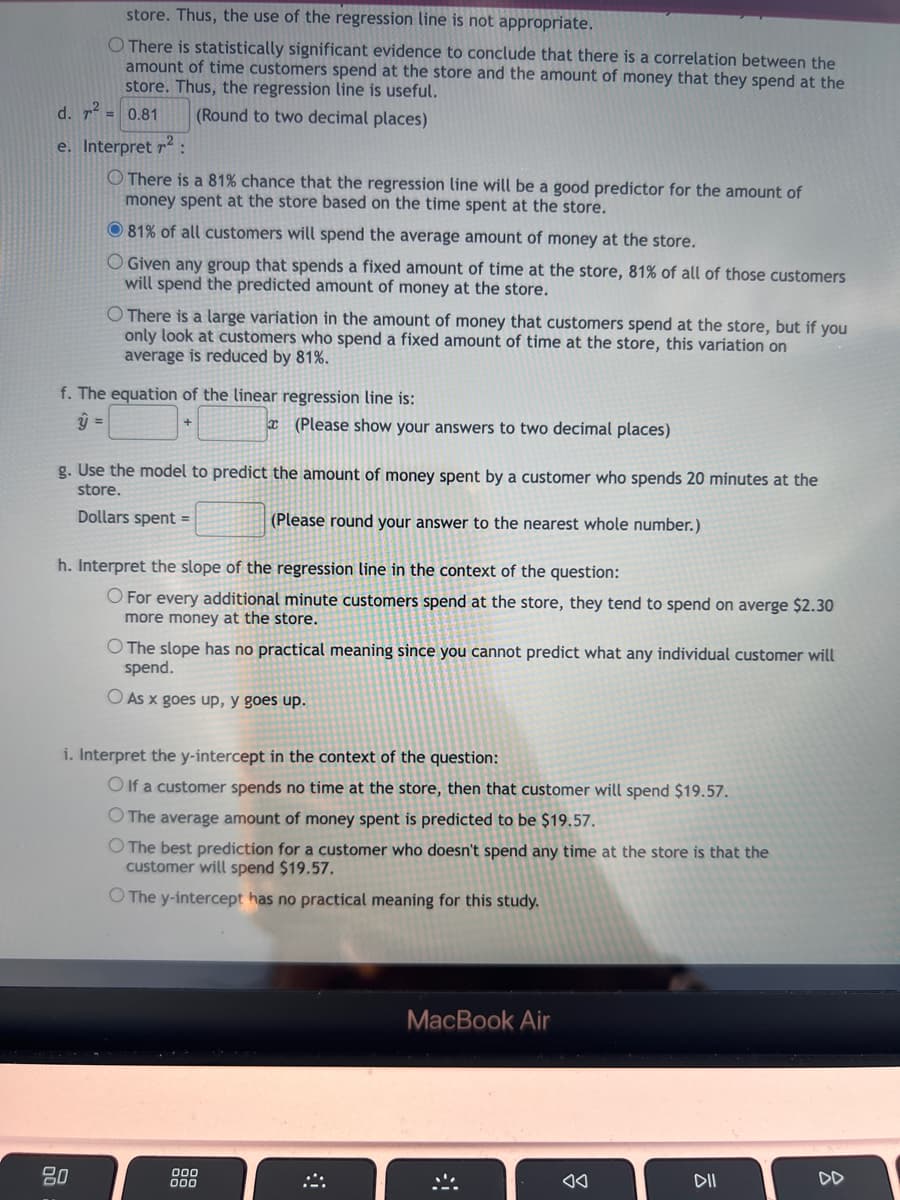
d. r² = 0.81
(Round to two decimal places)
e. Interpret ²:
There is a 81% chance that the regression line will be a good predictor for the amount of
money spent at the store based on the time spent at the store.
81% of all customers will spend the average amount of money at the store.
Given any group that spends a fixed amount of time at the store, 81% of all of those customers
will spend the predicted amount of money at the store.
O There is a large variation in the amount of money that customers spend at the store, but if you
only look at customers who spend a fixed amount of time at the store, this variation on
average is reduced by 81%.
f. The equation of the linear regression line is:
ŷ =
g. Use the model to predict the amount of money spent by a customer who spends 20 minutes at the
store.
Dollars spent =
(Please round your answer to the nearest whole number.)
80
(Please show your answers to two decimal places)
h. Interpret the slope of the regression line in the context of the question:
O For every additional minute customers spend at the store, they tend to spend on averge $2.30
more money at the store.
O The slope has no practical meaning since you cannot predict what any individual customer will
spend.
O As x goes up, y goes up.
i. Interpret the y-intercept in the context of the question:
Olf a customer spends no time at the store, then that customer will spend $19.57.
O The average amount of money spent is predicted to be $19.57.
O The best prediction for a customer who doesn't spend any time at the store is that the
customer will spend $19.57.
O The y-intercept has no practical meaning for this study.
000
000
MacBook Air
DII
DD
Expert Solution
This question has been solved!
Explore an expertly crafted, step-by-step solution for a thorough understanding of key concepts.

Step by step
Solved in 3 steps with 4 images

Recommended textbooks for you
Glencoe Algebra 1, Student Edition, 9780079039897…
Algebra
ISBN:
9780079039897
Author:
Carter
Publisher:
McGraw Hill
Glencoe Algebra 1, Student Edition, 9780079039897…
Algebra
ISBN:
9780079039897
Author:
Carter
Publisher:
McGraw Hill