Fiber content (in grams per serving) for 18 high fiber cereals are shown below. Fiber Content 6. 10 10 6 6 12 12 9. 13 10 9 12 6. 14 6. 9. 9. In USE SALT (a) Find the median, quartiles, and interquartile range for the fiber content data set. median lower quartile %3D upper quartile interquartile range
Fiber content (in grams per serving) for 18 high fiber cereals are shown below. Fiber Content 6. 10 10 6 6 12 12 9. 13 10 9 12 6. 14 6. 9. 9. In USE SALT (a) Find the median, quartiles, and interquartile range for the fiber content data set. median lower quartile %3D upper quartile interquartile range

Glencoe Algebra 1, Student Edition, 9780079039897, 0079039898, 2018
18th Edition
ISBN:9780079039897
Author:Carter
Publisher:Carter
Chapter10: Statistics
Section10.3: Measures Of Spread
Problem 1GP

Related questions
Question
100%
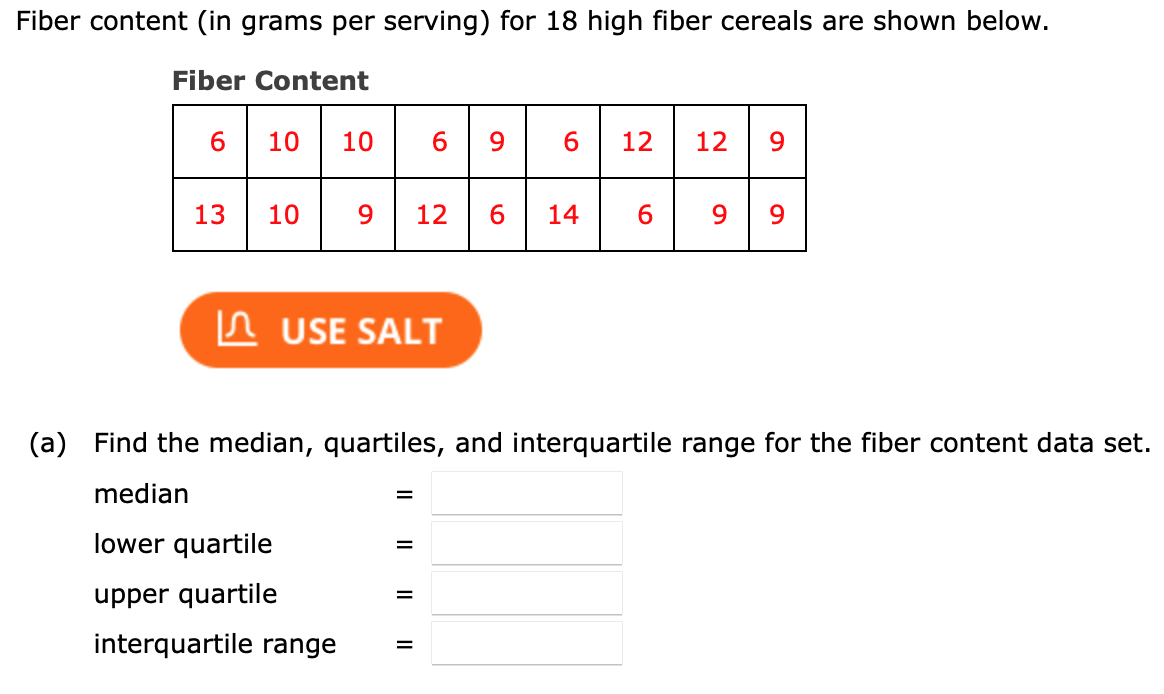
Transcribed Image Text:Fiber content (in grams per serving) for 18 high fiber cereals are shown below.
Fiber Content
6.
10
10
6.
9.
12
12
9.
13
10
9
12
6.
14
6.
9.
n USE SALT
(a)
Find the median, quartiles, and interquartile range for the fiber content data set.
median
lower quartile
%3D
upper quartile
interquartile range
Expert Solution
This question has been solved!
Explore an expertly crafted, step-by-step solution for a thorough understanding of key concepts.

This is a popular solution!

Trending now
This is a popular solution!

Step by step
Solved in 2 steps

Recommended textbooks for you
Glencoe Algebra 1, Student Edition, 9780079039897…
Algebra
ISBN:
9780079039897
Author:
Carter
Publisher:
McGraw Hill
Glencoe Algebra 1, Student Edition, 9780079039897…
Algebra
ISBN:
9780079039897
Author:
Carter
Publisher:
McGraw Hill