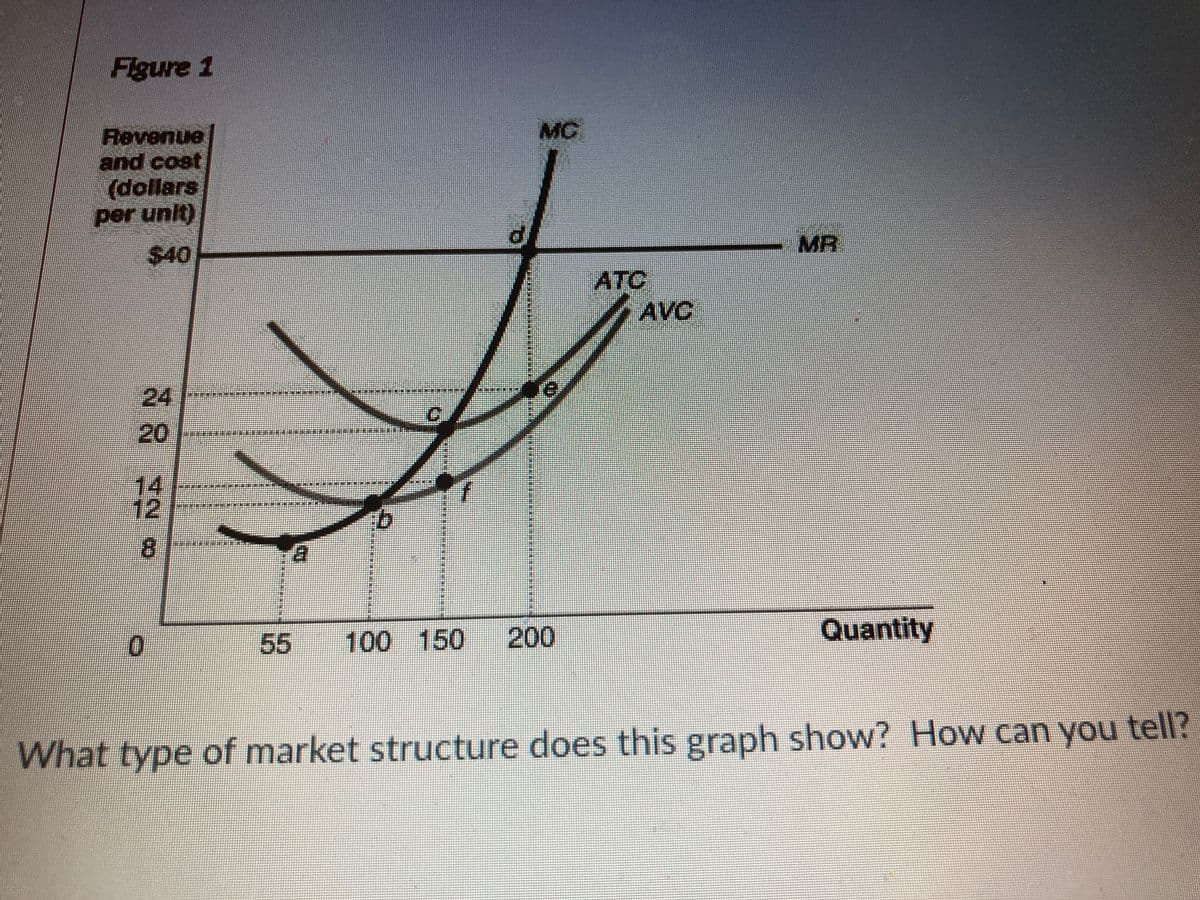
Figure 1 MC Revenue and cost (dollars per unit) MR $40 ATC AVC 24 C. 20 14 12 200 Quantity 100 150 Vhat type of market structure does this graph show? How can you tell?


Q: 1. An entrepreneur is thinking of starting a firm. The firm will pay Tk. 320,000 in wages/salary,…
A: Accounting profit, also referred to as bookkeeping profit or financial profit, is net income earned…
Q: Corn Market: High Price James' Costs Mentor James' Costs Let's take a look at my costs. James' Costs…
A: At profit maximizing level of output:- Marginal Cost= Marginal…
Q: Question Completion Status: QUESTION 1 Refer to the graph below: Price 24T 22 MC 20 18 ATC 16 14 AVC…
A: Here since the Marginal revenue (MR) curve lies below the Demand (D) curve it can be concluded that…
Q: (a) Fill in the table below. Instructions: Round your answers to the nearest whole number. Total…
A: Since you have asked multiple questions and according to our policy we will only solve the 1st…
Q: Quantity Total Cost Marginal Cost Total Revenue Marginal Revenue Profit (Dollars) (Dollars)…
A: Marginal cost = change in total cost / change in quality MC (at Q = x) = TCx – TCx-1 / Qx – Qx-1…
Q: Q1. Pizzas sell for $13 each. Pat's cost of producing pizzas is given below. Complete the table:…
A: Total cost is defined as the sum of fixed cost and variable cost. The fixed cost is the cost that…
Q: Ball Bearings, Inc. faces costs of production as follows: Table 1: Ball Bearing Inc. Production…
A: Average Fixed Cost = Fixed Cost / Quantity Average Variable Cost = Variable Cost / Quantity Marginal…
Q: Description Given the following graph, please label the curves where asked and answer the…
A: Here ,we have to find profit - maximizing level of output.
Q: Assignment 1. Find the value of A,B,C,D & E. Add $8 with FC. New FC=$10, now assuming quantity and…
A: The variable cost is the cost that varies with change in the output. The fixed cost is the cost that…
Q: Calculate Price, Average Revenue, Marginal revenue. Explain the conditions under which these values…
A: Since you have asked multiple question, we will solve the first question for you. If you want any…
Q: Caroline opens a lemonade stand for two hours. She spends $15 for ingredients and sells $50 worth…
A: In economics, the cost is divided into two types such that implicit and explicit according to which…
Q: Use the following information to answer Questions 11 and 12: Suppose a dentist is organized as a…
A: Hey, thank you for the question, since there is multiple question posted, according to our policy we…
Q: Kindly find the remaining values and writ the comments on the results?
A: The remaining values can be found using the following formulas Arc elasticity is calculated by…
Q: Question 4 a. The following presents the costs and revenues for a firm. Quantity Total Cost Marginal…
A: Note: Since you have posted multiple independent questions in the same request, we will solve the…
Q: Calculate the economic losses for Firm 1 if they decide not to produce -$_ 用目 Firm 2 Firm 1 Output =…
A: Here, given information about firm 1 is: Output: 10 Average fixed cost: $1 Average variable cost:…
Q: (Figure: Pineapples) Refer to the figure. What is their total profit or loss?…
A: The profit is defined as an excess revenue that has been made by the firm that has deducting the…
Q: Graph the ATC and MC below and explain
A: The marginal cost (MC) represents the additional costs incurred in producing one extra unit of the…
Q: Question 1 Table 1 below shows Samsung's Company production for washing machine in a week. The total…
A: Output TC MC P TR MR Profit 0 10 0 1 35 20 2 40 3 50 4…
Q: Marginal Cost and Marginal Revenue MR, MC, $/item 100 5아 50 100 150 q, items 200 -50- Label the…
A: The blue line is the marginal revenue curve and the yellow line is the marginal cost curve.…
Q: C. Fill in the average revenue and marginal revenue in the table. Output (Q) Total Revenue (TR)…
A: The sum of money generated per unit of output is referred to as average revenue. In other words, it…
Q: Table #1: The following table presents cost and revenue information for Soper's Port Vineyard.…
A: Formula of calculating average revenue AR = TR ÷ Q
Q: Ques 6 For a firm to be in equilibrium, Marginal Revenue (MR) and Marginal Cost (MC) must be and…
A: In a market, an equilibrium is one at which firms and households both are able to maximize their…
Q: 14) In imperfect competition, firms should produce and sell units until the equals the A) marginal…
A: When talking about imperfectly competitive market, it is the place where firms have incentive to…
Q: The curves show the marginal cost (MC), average variable cost (AVC), marginal revenue (MR), and…
A: The total cost incurred by a firm is the sum of fixed costs and variable costs. Fixed costs do not…
Q: Quantity Total Cost Marginal Cost Total Revenue Marginal Revenue Profit $8 $0 1 10 16
A: Marginal Cost = Change in the total cost ÷ Change in quantity Marginal Revenue = Change in total…
Q: 6. A firm manufactures and markets a product that sells for Birr 20 per unit. Fixed costs associated…
A: Since you have posted a question with multiple sub-parts, we will solve first three subparts for…
Q: Webby Inc. is a web development company. Webby's monthly production function for developing websites…
A: Marginal product is the change in output/total product when an additional unit of input is hired.…
Q: Question: P ($) TR ($) MR ($) TC АTC ($)| MC ($) ($) Y Average Total |Output Price Marginal Total…
A:
Q: 1. What are the conditions of Economic profit, economic loss and breakeven point of
A: Perfect competition refers to the market where market equilibrium is decided by the market forces of…
Q: Question 1. Calculate Average Revenue (AR) and Marginal Revenue (MR). Units 1| 2 3 4 56 7 Sold TR ()…
A:
Q: Question 4 a. The following presents the costs and revenues for a firm. Quantity Total Cost Marginal…
A: To maximise profits 6 units should be produced,because after that profit declines.
Q: A farmer’s fields are right next to the train tracks, where sparks from the trains set the field on…
A: “Since you have posted a question with multiple sub-parts, we will solve first three subparts for…
Q: 2. The following table depicted a computer manufacturer's total cost of producing computer: Quantity…
A: Quantity Price (TC) FC VC AVC ATC MC 0 500000 500000 0 0 0 0 1 540000 500000 40000 40000 540000…
Q: Problem-3: Consider total cost and total revenue given in the following table. Quantity Total…
A: MC = Change in TCQuantity MR = Change in TRQuantity TR = Price × Quantity Profit = TR - TC
Q: 7elow diagram, what will happen at Q3, the firm 6418768 647 TC TR 95d647fd7b8 00 id7b8 71d7b8 Q1 Q2…
A: The Total Revenue is the amount of revenue generated by selling all the given units of goods and…
Q: Explain the block chain technology in agricultural and give examples
A: The economies around the globe are involved in various types of economic and financial activities,…
Q: Refer to the table. If the firm produces 5 units that it sells at a price of $30.00 each, what will…
A: Use the below formula to find the profit and loss: Profit / Loss = Total Revenue - Total CostTotal…
Q: Reggie owns and operates a cheese shop in the village of Somerset. Although Reggie has a degree in…
A: A firm maintains a record of its profit in two ways that are accounting profit and economic profit.…
Q: Vicky quit her $ 75, 000 a year marketing executive job to open her own firm. In Vicky's first year…
A: The accounting profits are the difference between the total revenue and the total explicit cost. It…
Q: 4. (Table) Based on the table, what price does J Output Marginal Cost Total Revenue 1,200 1,300…
A: Total Revenue = Price * Output => Price = Total Revenue / Output From the given table…
Q: A farmer’s fields are right next to the train tracks, where sparks from the trains set the field on…
A: 1. (c) 2 The socially optimal level is that the outcome that causes the smallest amount harm. When 2…
Q: Karen runs a print shop that makes posters for large companies. It is a very competitive business.…
A: Given information, Market price=$1 Fixed cost=$250 Variable cost for 1000 posters=$1800 Variable…
Q: Hayfever Farms is an 80-acre hay farm in Colorado. The owners are considering changing the farm's…
A: The profit-maximizing condition is given below: Marginal Cost = Marginal RevenueMC = MR
Q: What level of output does Greensons Organic maximize profit? Justify/explain your answer and show…
A: Marginal cost is the additional cost incurred in order to produce an additional unit of output…
Q: Revenue and Cost Data for a Perfectly Competitive Firm Daily Output Price Total Revenue TFC TVC TC…
A: Profit of the firm is calculated as the difference between total revenue and the total cost. Total…
Q: Charlie Co. sells pastries and its production and cost table is given below. A worker costs $100 a…
A: Marginal cost measures the additional cost incurred in order to produce one additional unit of…

Step by step
Solved in 2 steps


- HighFlyer Airlines wants to build new airplanes with greatly increased cabin space. This will allow HighFlyer Airlines to give passengers more comfort and sell more tickets at a higher price. However, redesigning the cabin means rethinking many other elements of the airplane as well, like engine and luggage placement, and the most efficient shape of the plane for moving through the air. HighFlyer Airlines has developed a list of possible methods to increase cabin space, along with estimates of how these approaches would affect the planes operating costs and ticket sales. Based on these estimates, Table 13.5 shows the value of R, how much should the firm invest in R on top of the private return; that is, an R private return to HighFlyer Airlines would have a 9 social return. How much investment is socially optimal at the 6 interest rate?A firm produces two different kinds, A and B, of a commodity. The daily cost of producingx units of A and y units of B isC(x, y) = 2x2 − 4xy + 4y2 − 40x − 20y + 514Suppose that the firm sells all its output at a price per unit of $24 for A and $12 for B. Findthe daily production levels x and y that maximize profit. (Be sure to show your first andsecond order conditions.)Lecture: Externality - Pigou8. All-Leather is a tanning company located on Lake Michigan in Chicago. Its total cost functionis C(QA) = 125 + 8QA + 5QA2, where QA is leather production per week in thousands of pounds.a) If leather sells for $408 per thousand pounds, how much leather will All-Leather produce?How much profit does All-leather earn?Enjoy is a beverage company located on Lake Michigan near All-Leather in Chicago. Enjoy’sproduction of beverages is negatively affected by water pollution from All-Leather’s productionof leather. Enjoy’s total cost function to produce beverages isC(QE) = 10QE +3QE2 + 3QA2where QE is Enjoy’s weekly production of beverages, in thousandsof gallons and, as above, QA is All-Leather’s weekly production of leather.b) Is this an example of a pecuniary externality or a real externality? Explain.c) What is the extra cost to Enjoy from an additional thousand tons of leather production by AllLeather (i.e., the external marginal cost of an extra unit of QA…
- A steel foundry emits fumes that lead to a marked reduction in air quality for localinhabitants. a) Draw a diagram to show that at the foundry’s profit maximising output marginalsocial cost exceeds marginal private cost.Please no written by hand and no image SEU ELITE - ECON101 Question 8 The table below shows the marginal benefit that Yahya earns from keeping his store open one more hour. Yahya has a marginal cost of $100 per hour. Yahya stays open 8 hours. Hours {:[" Marginal Benefit Per "],[" Hour "]:} 8 180 9 150 10 140 11 120 12 100 13 80 14 50 a) Do you think Yahya's decision to stay open 8 hours is optimal? Why? b) How many hours do you advise Yahya to stay open? Why?41- A colleague at work takes small amounts of IT supplies such as flash drive for her own personal use, saying that this is a tiny loss to the company. You tell her that if everyone were to take office supplies, then the loss would no longer be minimal . Your rationale expresses which of the following ethical issues: O a Property issues O bPrivacy issues Oc Accuracy issues O d Accessibility issues
- Each time a song is played on the radio, the record company and the songwriter are paid a royalty of $0.30.Of the total, 75% goes to the company and the rest to the writer. If on a network of 50 radio stations, a certainsong is played 4 times a day during the first week and then 20 times a day for the next three weeks, how muchdoes the network owe in royalties for the four weeks? How much do the record company and the songwriterreceive eachThe following is cost information for the Creamy Crisp Donut Company:Entrepreneur's potential earnings as a salaried worker = $50,000Annual lease on building = $22,000Annual revenue from operations = $380,000Payments to workers = $120,000Utilities (electricity, water, disposal) costs = $8,000Value of entrepreneur's talent in the next best entrepreneurial activity = $80,000Entrepreneur's forgone interest on personal funds used to finance the business = $6,000Refer to the data. Creamy Crisp's implicit costs are: A. $150,000 B. $94,000 C. $136,000 D. $156,000AVC=10-0.03Q + 0.00005Q2TFC=60What is the output where AVC is minimum?
- A. Using the MR = MC rule, what is the profit-maximizing level of output (in thousandsof KWHs)?GivenMonthly rent25,000Monthly Salary/employee10,000Market price of slippers520Total units sold20,000 Solve for the followingTotal RevenueTotal CostProfit/Loss (indicate if its a profit or loss)Explain Gresham’s