FIGURE 11.55 is a state transition diagram for a sequential circuit with three flip-flops and one input. It counts up in binary when the input is 1 and counts down when the input is 0. Design the circuit and draw the logic diagram using the following flip-flops: (b) SR
FIGURE 11.55 is a state transition diagram for a sequential circuit with three flip-flops and one input. It counts up in binary when the input is 1 and counts down when the input is 0. Design the circuit and draw the logic diagram using the following flip-flops: (b) SR

Chapter4: Processor Technology And Architecture
Section: Chapter Questions
Problem 24VE: _____ predicts that transistor density will double every two years or less.

Related questions
Question
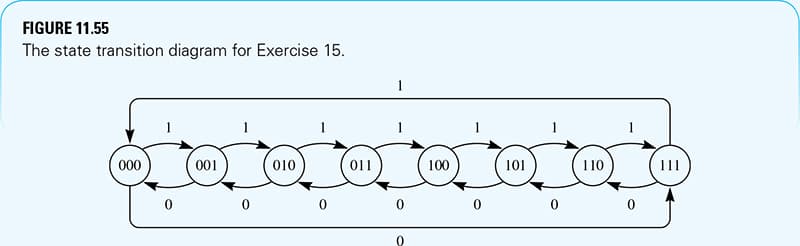
FIGURE 11.55 is a state transition diagram for a sequential circuit with three flip-flops and one input. It counts up in binary when the input is 1 and counts down when the input is 0. Design the circuit and draw the logic diagram using the following flip-flops:
(b) SR
Transcribed Image Text:FIGURE 11.55
The state transition diagram for Exercise 15.
1
000
001
010
011
100
101
110
111
Expert Solution
This question has been solved!
Explore an expertly crafted, step-by-step solution for a thorough understanding of key concepts.

This is a popular solution!

Trending now
This is a popular solution!

Step by step
Solved in 2 steps with 1 images

Knowledge Booster


Learn more about
Need a deep-dive on the concept behind this application? Look no further. Learn more about this topic, computer-science and related others by exploring similar questions and additional content below.Recommended textbooks for you
Systems Architecture
Computer Science
ISBN:
9781305080195
Author:
Stephen D. Burd
Publisher:
Cengage Learning

Enhanced Discovering Computers 2017 (Shelly Cashm…
Computer Science
ISBN:
9781305657458
Author:
Misty E. Vermaat, Susan L. Sebok, Steven M. Freund, Mark Frydenberg, Jennifer T. Campbell
Publisher:
Cengage Learning
Systems Architecture
Computer Science
ISBN:
9781305080195
Author:
Stephen D. Burd
Publisher:
Cengage Learning
Enhanced Discovering Computers 2017 (Shelly Cashm…
Computer Science
ISBN:
9781305657458
Author:
Misty E. Vermaat, Susan L. Sebok, Steven M. Freund, Mark Frydenberg, Jennifer T. Campbell
Publisher:
Cengage Learning