Figure 7 of Conrad et al. (1999) shows the variation in C-isotopic composition of CO2 as a function of the concentration of methane measured in the soil and aquifers of a site contaminated in the residues of aviation fuels. Explain briefly the aim of these particular measurements made to the environmental study. Also explain briefly why there


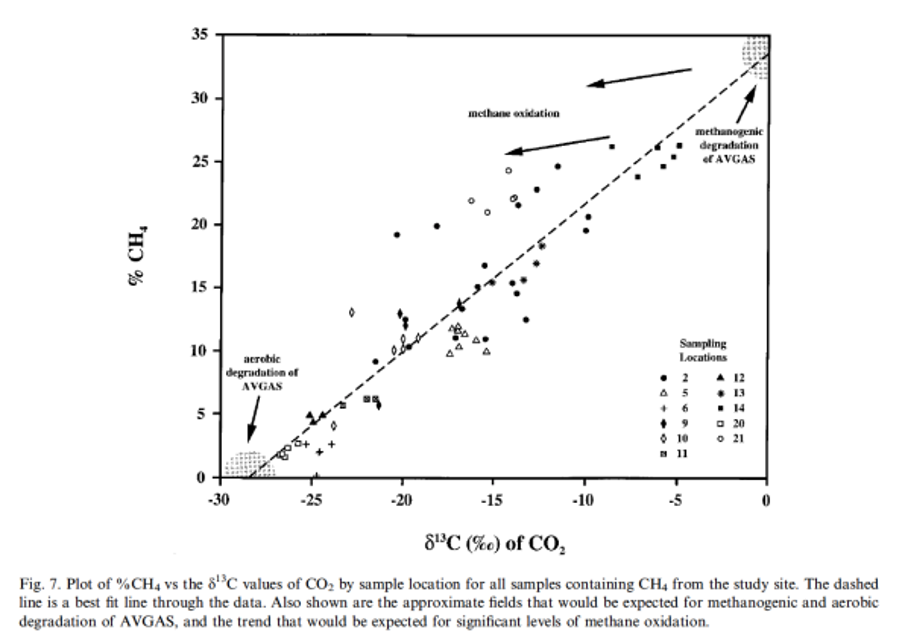
Figure 7 of Conrad et al. (1999) shows the variation in C-isotopic composition of CO2 as a function of the concentration of methane measured in the soil and aquifers of a site contaminated in the residues of aviation fuels.
Explain briefly the aim of these particular measurements made to the environmental study.
Also explain briefly why there is a difference in isotopic composition of CO2 obtained via aerobic degradation and methanogenic degradation of AVGAS (fuel residues as contaminants) and the linear “mixing relationship” noted in Figure 7.
How does the degradation process influence the CO2 isotopic signature ? I don't understand why the CO2 from aerobic degradation is lighter than the one from methnogenic degradation ?

Step by step
Solved in 5 steps


