Find estimated intercept trendlines for: Quarter 1, Quarter 2, Quarter 3, and Quarter Jivi
Find estimated intercept trendlines for: Quarter 1, Quarter 2, Quarter 3, and Quarter Jivi

Functions and Change: A Modeling Approach to College Algebra (MindTap Course List)
6th Edition
ISBN:9781337111348
Author:Bruce Crauder, Benny Evans, Alan Noell
Publisher:Bruce Crauder, Benny Evans, Alan Noell
Chapter5: A Survey Of Other Common Functions
Section5.6: Higher-degree Polynomials And Rational Functions
Problem 1TU: The following fictitious table shows kryptonite price, in dollar per gram, t years after 2006. t=...

Related questions
Question
E3
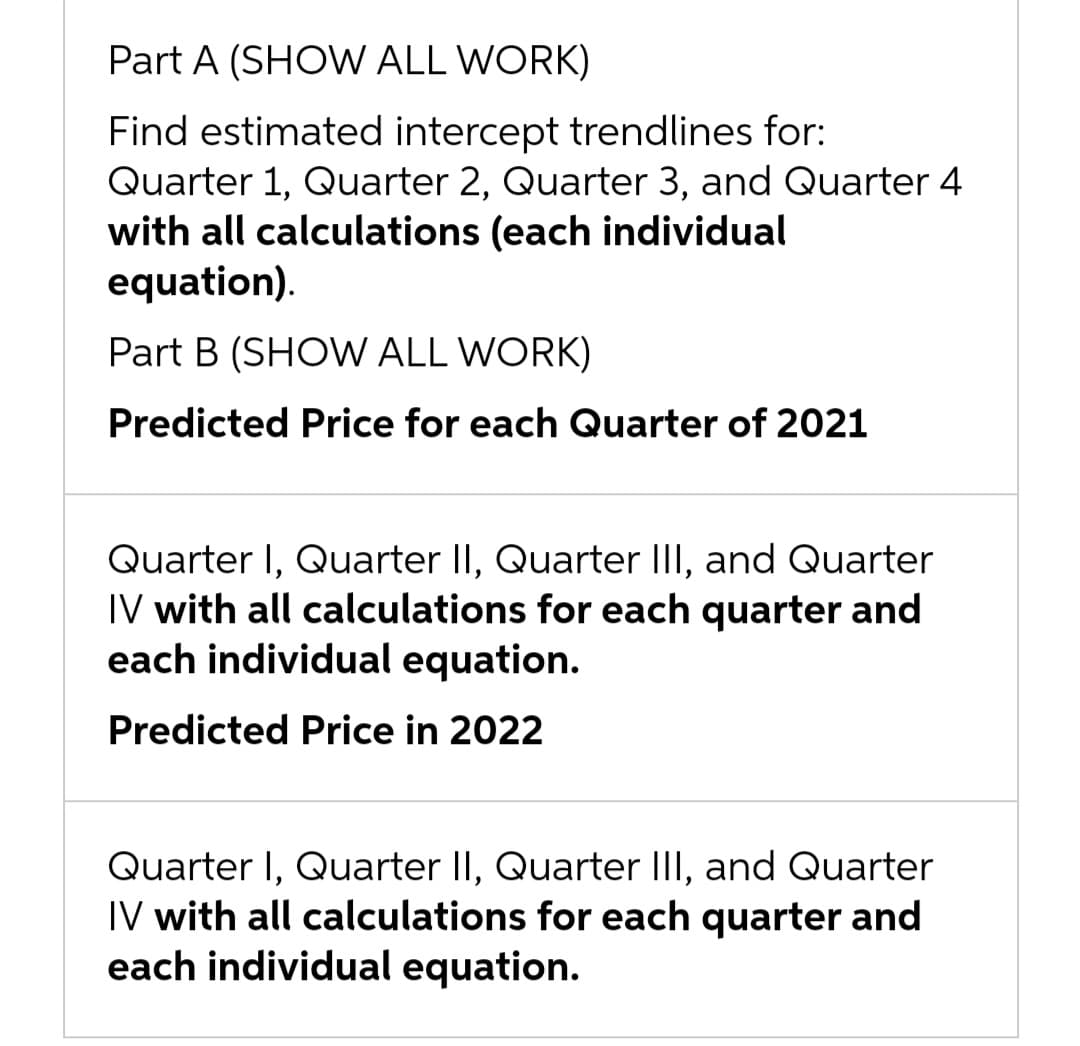
Transcribed Image Text:Part A (SHOW ALL WORK)
Find estimated intercept trendlines for:
Quarter 1, Quarter 2, Quarter 3, and Quarter 4
with all calculations (each individual
equation).
Part B (SHOW ALL WORK)
Predicted Price for each Quarter of 2021
Quarter I, Quarter II, Quarter III, and Quarter
IV with all calculations for each quarter and
each individual equation.
Predicted Price in 2022
Quarter I, Quarter II, Quarter III, and Quarter
IV with all calculations for each quarter and
each individual equation.
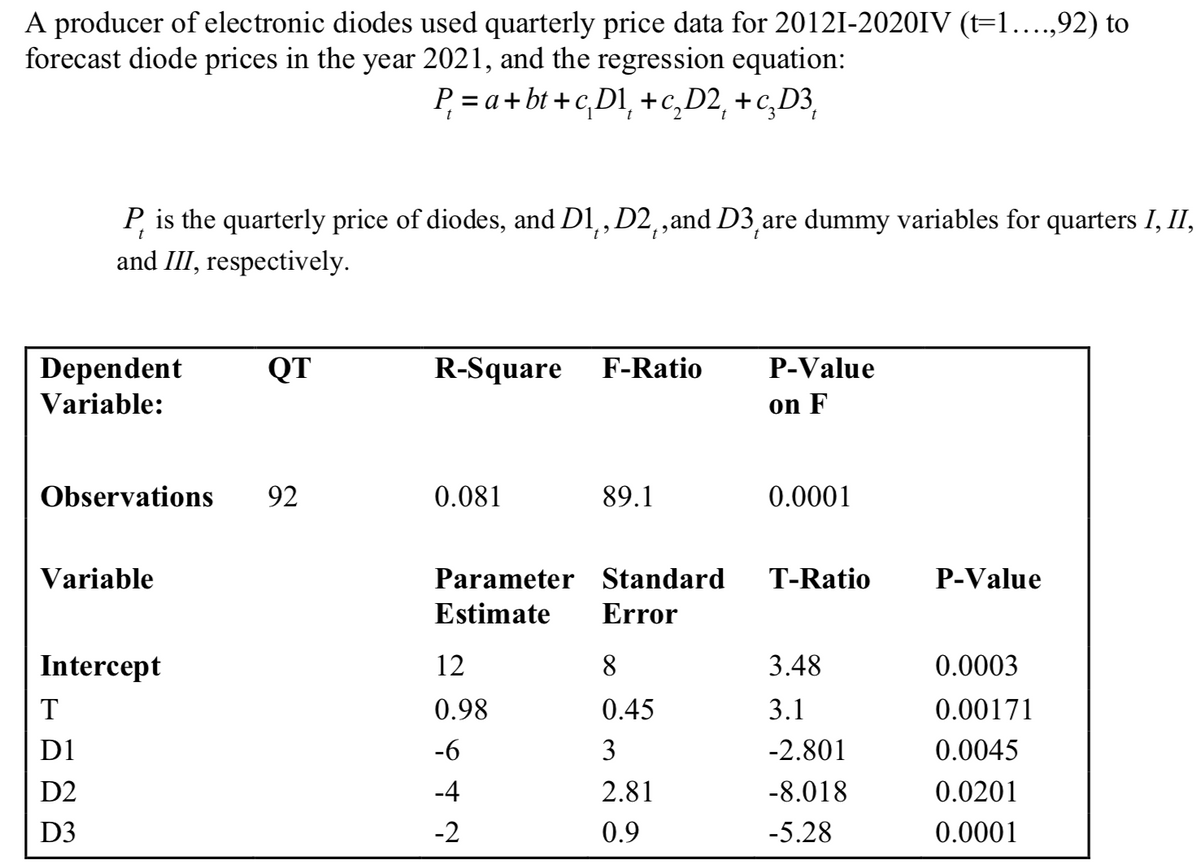
Transcribed Image Text:A producer of electronic diodes used quarterly price data for 20121-2020IV (t=1....,92) to
forecast diode prices in the year 2021, and the regression equation:
Dependent
Variable:
t
P, is the quarterly price of diodes, and D1, D2,,and D3,are dummy variables for quarters I, II,
and III, respectively.
Observations 92
Variable
Intercept
T
D1
D2
D3
QT
P₁ = a + bt+c₂D¹, +c₂D2 + c₂D³
t
R-Square F-Ratio
0.081
Parameter Standard
Estimate Error
12
0.98
-6
642
-4
89.1
-2
8
0.45
3
2.81
0.9
P-Value
on F
0.0001
T-Ratio
3.48
3.1
-2.801
-8.018
-5.28
P-Value
0.0003
0.00171
0.0045
0.0201
0.0001
Expert Solution
This question has been solved!
Explore an expertly crafted, step-by-step solution for a thorough understanding of key concepts.

Step by step
Solved in 3 steps

Recommended textbooks for you
Functions and Change: A Modeling Approach to Coll…
Algebra
ISBN:
9781337111348
Author:
Bruce Crauder, Benny Evans, Alan Noell
Publisher:
Cengage Learning

Trigonometry (MindTap Course List)
Trigonometry
ISBN:
9781305652224
Author:
Charles P. McKeague, Mark D. Turner
Publisher:
Cengage Learning

Algebra & Trigonometry with Analytic Geometry
Algebra
ISBN:
9781133382119
Author:
Swokowski
Publisher:
Cengage
Functions and Change: A Modeling Approach to Coll…
Algebra
ISBN:
9781337111348
Author:
Bruce Crauder, Benny Evans, Alan Noell
Publisher:
Cengage Learning
Trigonometry (MindTap Course List)
Trigonometry
ISBN:
9781305652224
Author:
Charles P. McKeague, Mark D. Turner
Publisher:
Cengage Learning
Algebra & Trigonometry with Analytic Geometry
Algebra
ISBN:
9781133382119
Author:
Swokowski
Publisher:
Cengage

College Algebra
Algebra
ISBN:
9781305115545
Author:
James Stewart, Lothar Redlin, Saleem Watson
Publisher:
Cengage Learning

Algebra and Trigonometry (MindTap Course List)
Algebra
ISBN:
9781305071742
Author:
James Stewart, Lothar Redlin, Saleem Watson
Publisher:
Cengage Learning