QUESTION 17 Use the provided density function to choose the best estimate for the proportion of the population found in the spe 0 Reference: 5-8 20 OB. 99% O C. 50% OD. 85% 40 60 80 100 120 The percent of the population between 20 and 80 is closest to O A. 70% 140
QUESTION 17 Use the provided density function to choose the best estimate for the proportion of the population found in the spe 0 Reference: 5-8 20 OB. 99% O C. 50% OD. 85% 40 60 80 100 120 The percent of the population between 20 and 80 is closest to O A. 70% 140

Functions and Change: A Modeling Approach to College Algebra (MindTap Course List)
6th Edition
ISBN:9781337111348
Author:Bruce Crauder, Benny Evans, Alan Noell
Publisher:Bruce Crauder, Benny Evans, Alan Noell
Chapter1: Functions
Section1.2: Functions Given By Tables
Problem 2TU: Use the table of values you made in part 4 of the example to find the limiting value of the average...

Related questions
Question
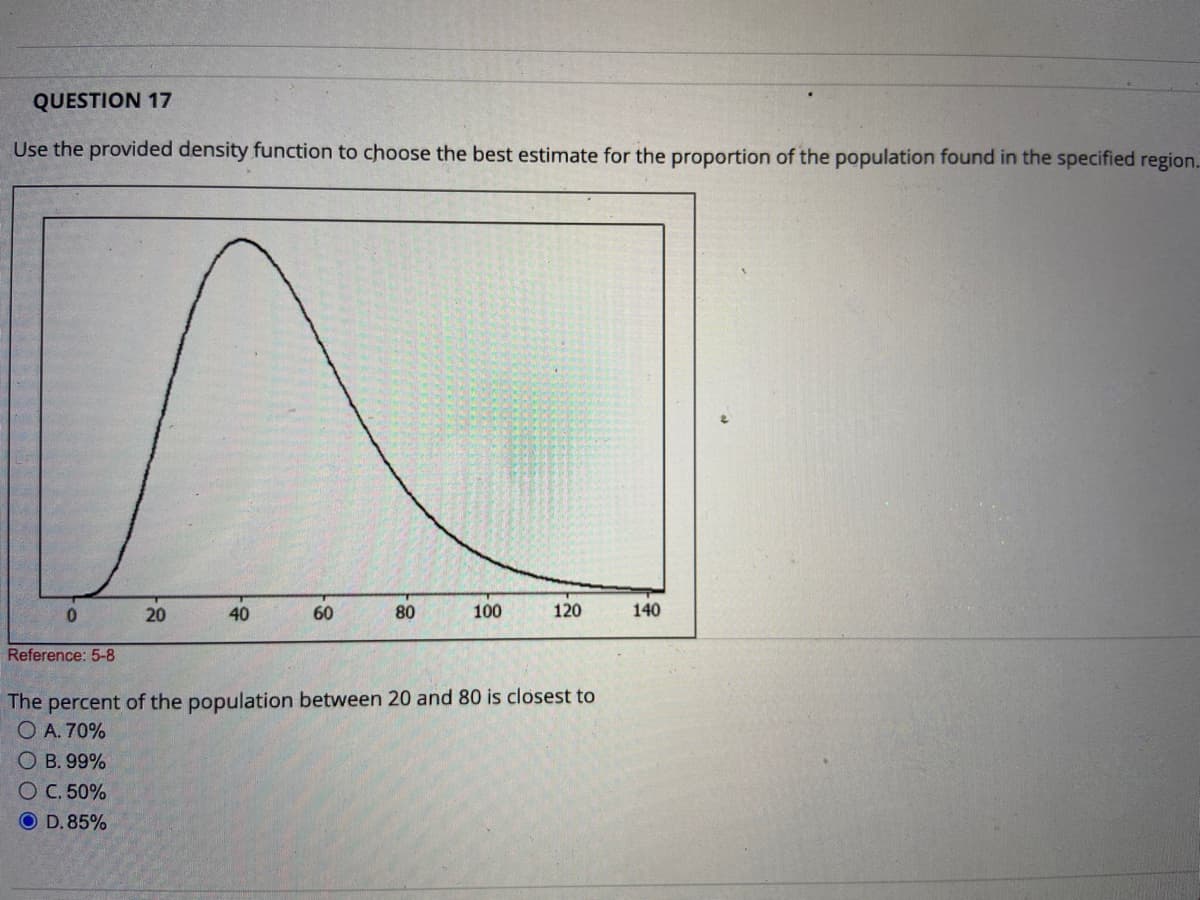
Transcribed Image Text:QUESTION 17
Use the provided density function to choose the best estimate for the proportion of the population found in the specified region..
0
Reference: 5-8
20
40
60
80
100
120
The percent of the population between 20 and 80 is closest to
O A. 70%
OB. 99%
O C. 50%
O D. 85%
140
Expert Solution
This question has been solved!
Explore an expertly crafted, step-by-step solution for a thorough understanding of key concepts.

This is a popular solution!

Trending now
This is a popular solution!

Step by step
Solved in 2 steps with 1 images

Recommended textbooks for you
Functions and Change: A Modeling Approach to Coll…
Algebra
ISBN:
9781337111348
Author:
Bruce Crauder, Benny Evans, Alan Noell
Publisher:
Cengage Learning

Algebra & Trigonometry with Analytic Geometry
Algebra
ISBN:
9781133382119
Author:
Swokowski
Publisher:
Cengage

Mathematics For Machine Technology
Advanced Math
ISBN:
9781337798310
Author:
Peterson, John.
Publisher:
Cengage Learning,
Functions and Change: A Modeling Approach to Coll…
Algebra
ISBN:
9781337111348
Author:
Bruce Crauder, Benny Evans, Alan Noell
Publisher:
Cengage Learning
Algebra & Trigonometry with Analytic Geometry
Algebra
ISBN:
9781133382119
Author:
Swokowski
Publisher:
Cengage
Mathematics For Machine Technology
Advanced Math
ISBN:
9781337798310
Author:
Peterson, John.
Publisher:
Cengage Learning,