Find the critical value(s) for a left-tailed z-test with a =0.06. Include a graph with your answer. The critical value(s) is(are) (Round to two decimal places as needed. Use a comma to separate answers as needed.) Draw a graph of the rejection region. Choose the correct graph below. OA. OB. Oc. OD.
Find the critical value(s) for a left-tailed z-test with a =0.06. Include a graph with your answer. The critical value(s) is(are) (Round to two decimal places as needed. Use a comma to separate answers as needed.) Draw a graph of the rejection region. Choose the correct graph below. OA. OB. Oc. OD.

Big Ideas Math A Bridge To Success Algebra 1: Student Edition 2015
1st Edition
ISBN:9781680331141
Author:HOUGHTON MIFFLIN HARCOURT
Publisher:HOUGHTON MIFFLIN HARCOURT
Chapter11: Data Analysis And Displays
Section: Chapter Questions
Problem 10CT

Related questions

Question
find the critical values for left-tailed z test with = 0.06. include a graph with your answer. Fine the critical value(s) is (are) =
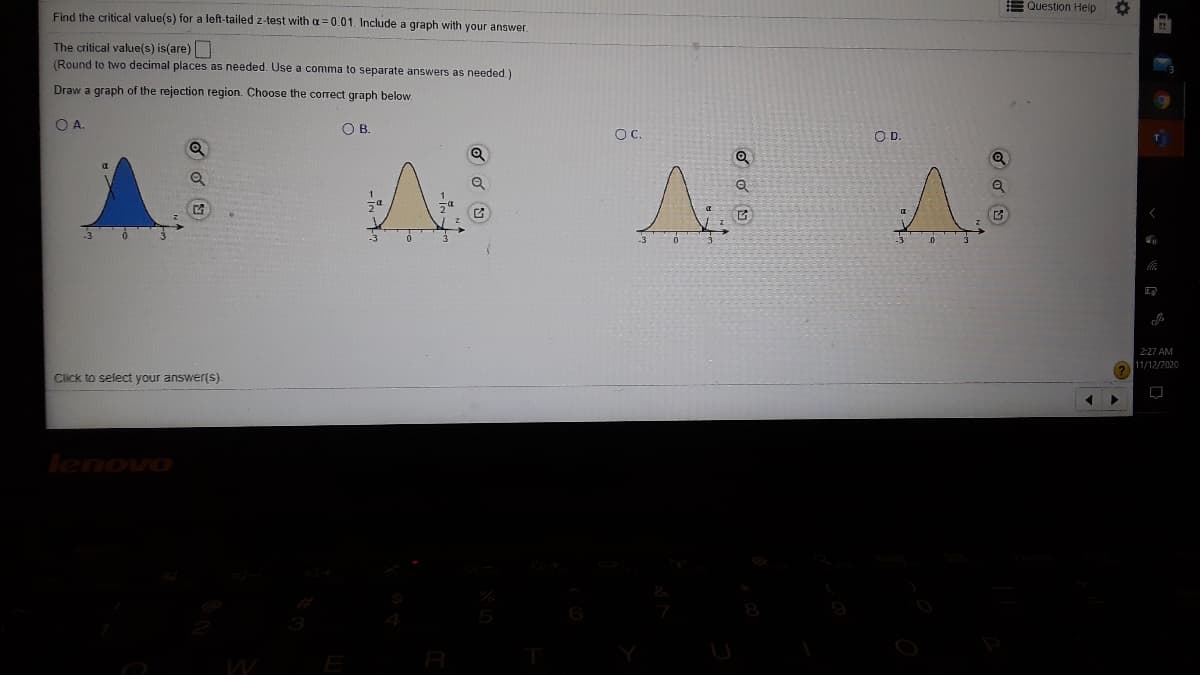
Transcribed Image Text:E Question Help
Find the critical value(s) for a left-tailed z-test with a= 0.01. Include a graph with your answer
The critical value(s) is(are)
(Round to two decimal places as needed. Use a comma to separate answers as needed.)
Draw a graph of the rejection region. Choose the correct graph below.
OA.
OB.
C.
OD.
1.
-3
-3
2:27 AM
11/12/2020
Click to select your answer(s)
lenovo
R
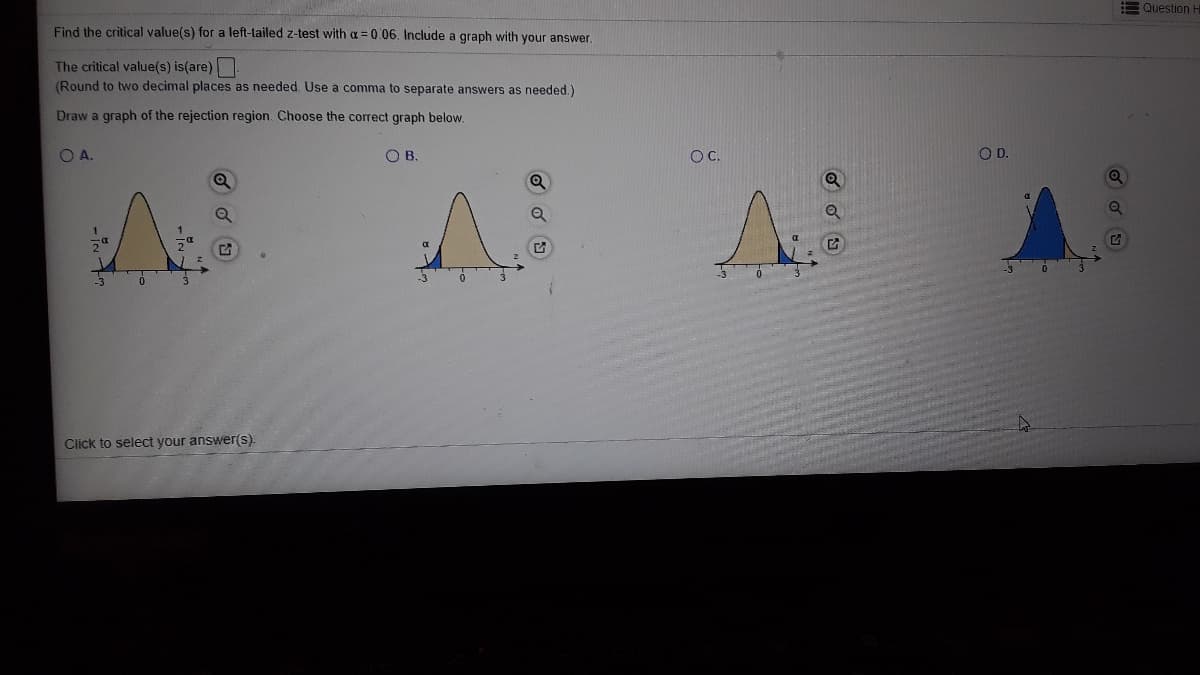
Transcribed Image Text:E Question H
Find the critical value(s) for a left-tailed z-test with a = 0.06. Include a graph with your answer.
The critical value(s) is(are)
(Round to two decimal places as needed. Use a comma to separate answers as needed.)
Draw a graph of the rejection region. Choose the correct graph below.
O A.
OB.
OC.
OD.
Click to select your answer(s).
Expert Solution
This question has been solved!
Explore an expertly crafted, step-by-step solution for a thorough understanding of key concepts.

This is a popular solution!

Trending now
This is a popular solution!

Step by step
Solved in 2 steps with 1 images

Knowledge Booster


Learn more about
Need a deep-dive on the concept behind this application? Look no further. Learn more about this topic, statistics and related others by exploring similar questions and additional content below.Recommended textbooks for you
Big Ideas Math A Bridge To Success Algebra 1: Stu…
Algebra
ISBN:
9781680331141
Author:
HOUGHTON MIFFLIN HARCOURT
Publisher:
Houghton Mifflin Harcourt
Big Ideas Math A Bridge To Success Algebra 1: Stu…
Algebra
ISBN:
9781680331141
Author:
HOUGHTON MIFFLIN HARCOURT
Publisher:
Houghton Mifflin Harcourt