The following table contains the measurements of the key length dimension from a fuel injector. These samples of size five were taken at one-hour intervals. Use three-sigma control limits. Use Exhibit 10.13 OBSERVATIONS SAMPLE NUMBER 1 0.485 0.498 0.495 0.494 0471 0.472 0.498 0.522 0.493 0.494 0.495 0.479 0.521 0.484 0.493 0.474 0.464 0518 0.512 0.509 2 0.482 0.503 0.485 0.503 0.499 0.484 0.513 0.498 0.503 0.504 0.483 0.519 0.512 0.483 0.525 0.504 0.482 0.492 0.517 0.519 0.462 0.513 0.483 0.504 0.493 0.472 0 504 0.483 0.482 0.473 0.507 0.492 0.485 0.482 0.461 0.483 0.471 0.472 0.506 0.507 0.482 0.506 0.524 0.507 0.507 0.483 0.485 0.486 0.493 0.506 0.486 0.523 0.521 0.483 0.487 0.496 0.506 0.495 0.512 0.493 0.488 0.523 0511 0.501 0.512 0.517 0.492 0.472 0.482 0.513 1 2 3 4 6. 8 10 11 12 13 14 15 16 17 0.483 0.451 0.513 0.524 0.519 0.503 0.485 0.483 0.527 0.482 18 19 20
The following table contains the measurements of the key length dimension from a fuel injector. These samples of size five were taken at one-hour intervals. Use three-sigma control limits. Use Exhibit 10.13 OBSERVATIONS SAMPLE NUMBER 1 0.485 0.498 0.495 0.494 0471 0.472 0.498 0.522 0.493 0.494 0.495 0.479 0.521 0.484 0.493 0.474 0.464 0518 0.512 0.509 2 0.482 0.503 0.485 0.503 0.499 0.484 0.513 0.498 0.503 0.504 0.483 0.519 0.512 0.483 0.525 0.504 0.482 0.492 0.517 0.519 0.462 0.513 0.483 0.504 0.493 0.472 0 504 0.483 0.482 0.473 0.507 0.492 0.485 0.482 0.461 0.483 0.471 0.472 0.506 0.507 0.482 0.506 0.524 0.507 0.507 0.483 0.485 0.486 0.493 0.506 0.486 0.523 0.521 0.483 0.487 0.496 0.506 0.495 0.512 0.493 0.488 0.523 0511 0.501 0.512 0.517 0.492 0.472 0.482 0.513 1 2 3 4 6. 8 10 11 12 13 14 15 16 17 0.483 0.451 0.513 0.524 0.519 0.503 0.485 0.483 0.527 0.482 18 19 20

MATLAB: An Introduction with Applications
6th Edition
ISBN:9781119256830
Author:Amos Gilat
Publisher:Amos Gilat
Chapter1: Starting With Matlab
Section: Chapter Questions
Problem 1P

Related questions
Question
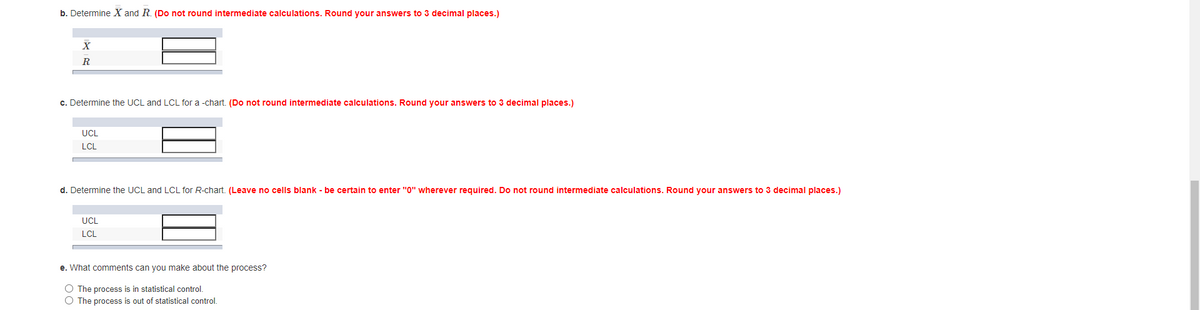
Transcribed Image Text:b. Determine X and R. (Do not round intermediate calculations. Round your answers to 3 decimal places.)
R
c. Determine the UCL and LCL for a -chart. (Do not round intermediate calculations. Round your answers to 3 decimal places.)
UCL
LCL
d. Determine the UCL and LCL for R-chart. (Leave no cells blank - be certain to enter "0" wherever required. Do not round intermediate calculations. Round your answers to 3 decimal places.)
UCL
LCL
e. What comments can you make about the process?
O The process is in statistical control.
O The process is out of statistical control.
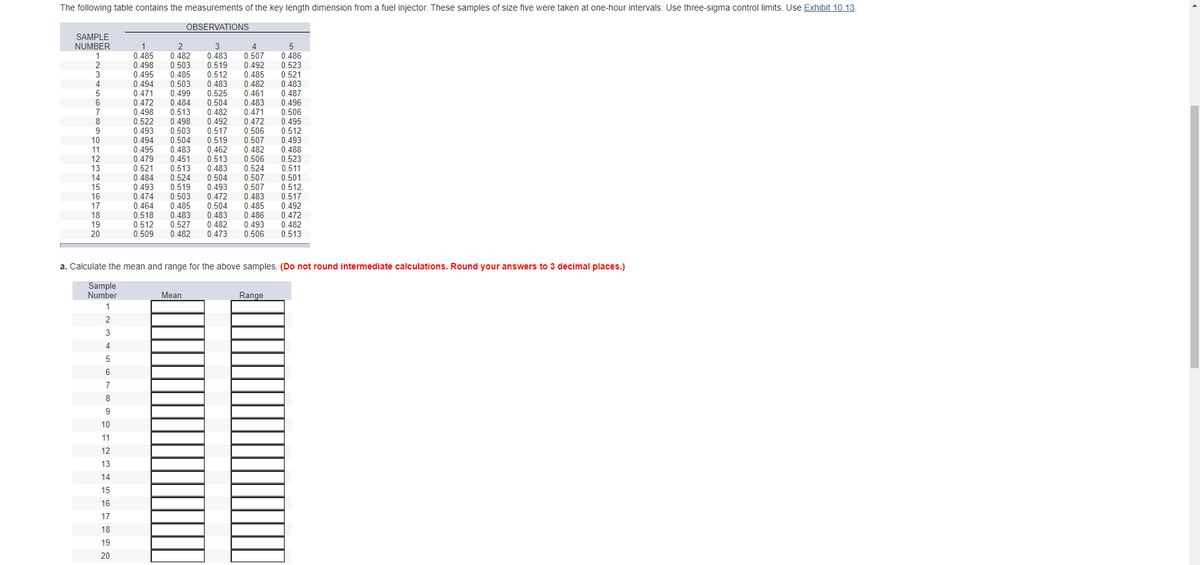
Transcribed Image Text:The following table contains the measurements of the key length dimension from a fuel injector. These samples of size five were taken at one-hour intervals. Use three-sigma control limits. Use Exhibit 10.13.
OBSERVATIONS
SAMPLE
NUMBER
1
1
0.485
3
0.482
0.503
0.485
0.503
0.499
0.484
0.513
0.498
0.503
0.504
0.483
0.451
0.513
0.524
0.519
0.483
0.519
0.512
0.483
0.525
0.504
0.482
0.492
0.517
0.519
0.462
0.513
0.483
0.504
0.493
4
0.507
0.492
0.485
0.482
0.461
0.483
0.471
0 472
0.486
0.523
0.521
0.483
0.487
0.496
0.506
0.495
0.512
0.493
0.488
0.523
0.511
0.501
0.512
0.498
0.495
0.494
0.471
0.472
3
4
6
7
0.498
0.522
0.493
0.494
0.495
0.479
0.521
0.484
0.493
9
0.506
0.507
0.482
0.506
0.524
0.507
0.507
0.483
0.485
0.486
0.493
0.506
10
11
12
13
14
15
0.474
0.464
0.518
0.512
0.509
0,503
0.485
0.483
0.527
0.482
0.472
0.504
0.483
0.482
0.473
0,517
0.492
0.472
0.482
0.513
16
17
18
19
20
a. Calculate the mean and range for the above samples. (Do not round intermediate calculations. Round your answers to 3 decimal places.)
Sample
Number
Mean
Range
1
2
3
4
5
6
7
8
9
10
11
12
13
14
15
16
17
18
19
20
Expert Solution
This question has been solved!
Explore an expertly crafted, step-by-step solution for a thorough understanding of key concepts.

This is a popular solution!

Trending now
This is a popular solution!

Step by step
Solved in 3 steps with 1 images

Knowledge Booster


Learn more about
Need a deep-dive on the concept behind this application? Look no further. Learn more about this topic, statistics and related others by exploring similar questions and additional content below.Recommended textbooks for you
MATLAB: An Introduction with Applications
Statistics
ISBN:
9781119256830
Author:
Amos Gilat
Publisher:
John Wiley & Sons Inc

Probability and Statistics for Engineering and th…
Statistics
ISBN:
9781305251809
Author:
Jay L. Devore
Publisher:
Cengage Learning

Statistics for The Behavioral Sciences (MindTap C…
Statistics
ISBN:
9781305504912
Author:
Frederick J Gravetter, Larry B. Wallnau
Publisher:
Cengage Learning
MATLAB: An Introduction with Applications
Statistics
ISBN:
9781119256830
Author:
Amos Gilat
Publisher:
John Wiley & Sons Inc
Probability and Statistics for Engineering and th…
Statistics
ISBN:
9781305251809
Author:
Jay L. Devore
Publisher:
Cengage Learning
Statistics for The Behavioral Sciences (MindTap C…
Statistics
ISBN:
9781305504912
Author:
Frederick J Gravetter, Larry B. Wallnau
Publisher:
Cengage Learning

Elementary Statistics: Picturing the World (7th E…
Statistics
ISBN:
9780134683416
Author:
Ron Larson, Betsy Farber
Publisher:
PEARSON

The Basic Practice of Statistics
Statistics
ISBN:
9781319042578
Author:
David S. Moore, William I. Notz, Michael A. Fligner
Publisher:
W. H. Freeman

Introduction to the Practice of Statistics
Statistics
ISBN:
9781319013387
Author:
David S. Moore, George P. McCabe, Bruce A. Craig
Publisher:
W. H. Freeman