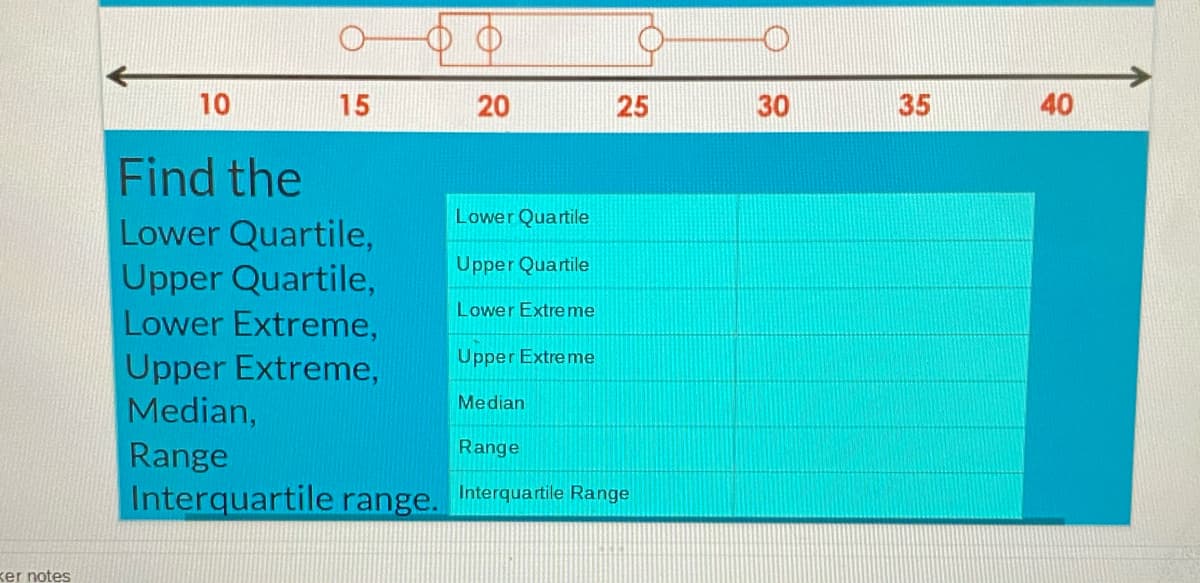
Find the Lower Quartile Lower Quartile, Upper Quartile, Lower Extreme, Upper Quartile Lower Extreme Upper Extreme Upper Extreme, Median, Median Range Range Interquartile range. Interquartile Range


Q: Base n this histogram, draw the ogive (the cumulative relative frequency polygon) for the test score…
A: Provided information is, the daily newspaper America at glance has just released the results of a…
Q: Find the mean, median, and mode of the given set of raw data. (Enter solutions for mode from…
A: Here we have given data, We have to find mean, mode, median. We first arrange the given data in…
Q: The side-by-side boxplots show the cumulative college GPAs for sophomores, juniors, and seniors…
A: Given, Boxplots show the cumulative college GPAs for sophomores, juniors, and seniors taking an…
Q: Q): PAve the fallowag identiles. ídentities. (6):- HS= In
A:
Q: onsider two data sets. (Refer to screensho
A: The mean formula is, x=∑xn Now, x=∑xn4=∑x5∑x=20 Now, If one score of X = 20 is added to the sample,…
Q: Construct a frequency distribution and a relative frequency histogram for the data set using five…
A: Class Frequency Relative frequency 52-58 7 7/24=0.2917 59-65 11 11/24=0.4583 66-72 5…
Q: Evaluate the first quartile Q1 , for the following data. 54, 69, 24, 75, 77, 83, 95, 100, 35, 110
A: Given data 54, 69, 24, 75, 77, 83, 95, 100, 35, 110 We want evaluate the first quartile Q1
Q: The National Football League (NFL) records a variety of performance data for individuals and teams.…
A: Given information: The data represents the values of the variables y, x1 and x2.
Q: The boxplots show the age of people involved in accidents according to their role in the accident:…
A: The boxplots show the age of people involved in accidents according to their role in the accident.…
Q: Percentile P20 < Percentile P70 < Median Select one: O True False
A:
Q: Find the mean, modes, minimum Q0 or X1, maximum Q4 or Xn, range, median, Q2, first quartile, third…
A:
Q: Find the population mean. Population: 5, 8, 3, 11, 13, 20
A: Given Data: 5, 8, 3, 11, 13, 20 n=10 ∑x=5+8+3+11+13+20=60
Q: The National Football League (NFL) records a variety of performance data for individuals and teams.…
A: Thanks for giving opportunity to serve for bartleby students, Hey, There ! Thank you for posting…
Q: Exercise 1. Of the 42 students enrolled in an Intro Stats course, the data below are the first 10…
A: Population is a collection of individuals or items that are the subjects of the study which are…
Q: Q2. Define population in terms of statistics and describe why are samples needed and how are they…
A: It is asked to define the population in terms of statistics and to describe why samples needed and…
Q: Kaylee is working at her neighborhood transportation engineering company researching peak hour…
A: The mean at congested intersection truck traffic is less than 10.43 percent/hr. Null Hypothesis:…
Q: The National Football League (NFL) records a variety of performance data for individuals and teams.…
A: Note: Hey, since there are multiple subparts posted, we will answer first three subparts. If you…
Q: a) List the data in a stem and leaf diagram b) Find the median c) Find the first and third quartiles
A: Note : as per policy I have calculated 3 SUBPARTS PLZ REPOST FOR REMAINING Here ascending order of…
Q: Here are the scores of 13 students on a science test. 57, 58, 59, 63, 65, 66, 69, 72, 73, 77, 77,…
A:
Q: Here are the scores of 14 students on a history test. 58, 59, 62, 63, 67, 69, 73, 73, 77, 78, 84,…
A: Solved below
Q: Find the population mean. Population: 3, 6, 10, 12, 14
A: Step 1 Given a data set 3, 6, 10, 12, 14. Firstly find the sum of observations and number of…
Q: The Student Government Association at Middle Carolina University wanted to demonstrate the…
A: Explanation: Enter the data in MS Excel Select the columns Beer and BAC Go to Insert tab Click on…
Q: In a recent survey, 8 college graduates were each asked for the number of hours they work each week.…
A:
Q: A high school teacher is interested in the number of text messages her students send during a one…
A: Given information: The data represents the frequency distribution of number of text messages sent by…
Q: a recent survey, 8 people were each asked the number of times they have bee 16, 26, 12, 9, 17, 26,…
A: Given data, 16,26,12,9,17,26,11,14 Range=?
Q: what range of raw scores makes up the middle 40%
A: The middle 40% means, the scores lie between 30th and 70th percentile. From stand normal, z-score…
Q: The 9 members of a fraternity have the following test scores: 119, 120, 122, 123, 124, 127, 128,…
A: A) The 9 members of a fraternity have the following test scores:119, 120, 122, 123, 124, 127, 128,…
Q: Wildfires are uncontrolled fires that usually spread common in wilderness areas that have long and…
A: Assumptions for one sample t test: The t statistic is used in the hypothesis testing, for testing…
Q: A line of best fit was drawn for 15 data points. What is the maximum number of these data points…
A: In linear regression a line of best fit is created. In simple linear regression there will be only…
Q: The finishing times of two runners for several one-mile races, in minutes, are shown in the box and…
A: The box and whisker plot for any given data is used to define the various parameters such as:…
Q: Consider the data set 23, 43, 19, 26, 33, 37, 29 a) Find the 75th percentile: b)Find the 1st…
A: we have to find 75 percentile and 1st quartile..
Q: A student at Phoenix High School conducted a survey. The student surveyed 100 of the 680 students…
A: Consider that in a sample of 100 student out of 680 students, the average number of APP's installed…
Q: Give 2 examples of Median in Measure of central tendency to grouped data
A:
Q: Identify statistics idenrify p
A: As the data has not been provided,I have explained the testing procedure.For answer,we just need to…
Q: Find the mode, median, mean, lower quartile, upper quartile, interquartile range, and draw a box and…
A: We need to compute mode, median, mean, lower quartile, upper quartile, interquartile range for the…
Q: Median as quartiles can be termed as Select one: a. Q4 b. Q2 C. Q3 d. Q1
A: GivenMedian as quartiles can be termed as
Q: The data shown in the boxplots shows monthly sales revenue figures ($ thousands) for a discount…
A: here given , three box plots of atlantic, central, and west respectively and IQR = third quartile -…
Q: The coefficlent of varlation for the following data is 60, 47, 75, 85, 58
A: The coefficient of variation is a statistical measure of the dispersion of data points in a data…
Q: The coefficlent of varlation for the followlng data Is 60, 47, 75, 85, 58 a. 23.05%
A: The sample mean is, x¯=∑xn=60+47+75+85+585=3255=65 The sample mean is 65. The sample standard…
Q: Use the following data set: 13, 8, 10, 7, 13, 9, 7, 11, 12, 10, 13 to answer questions The…
A: Given data is 13, 8, 10, 7, 13, 9, 7, 11, 12, 10, 13
Q: For the given dataset, find the range? 21,13,24,31,18,16,34,11
A: Given that The data set 21,13,24,31,18,16,34,11
Q: The best point estimate of the population is A.The sample mean B.The sample median…
A: We have to find best estimate for population parameter.
Q: Using the boxplot, find the following. 200 220 240 260 280 300 Part: 0/ 2 Part 1 of 2 Identify the…
A: Solution: Form the given boxplot we have to find the following; Maximum value Minimum value Median…
Q: ind the IQR ( Interquartile range) of the following data values: 35, 23, 12, 45, 31, 57, 61, 55, 36,…
A: The provided data set is: 35, 23, 12, 45, 31, 57, 61, 55, 36, 17
Q: Find the first quartile for following data 23,32,34,45,57,68
A: Given data, 23,32,34,45,57,68 Sort the data in ascending order 23,32,34,45,57,68 Find the first…
Q: The number of victories for each baseball league team in 2006 is listed below (image). (Source:…
A: Given,sample size(n)=30Arrange the given data in ascending order61, 62 ,66 , 67 , 70 , 71 , 75 ,…
Q: The measure of location which Is highly affected by outllers Is O A. Mean O B. Interquartile range O…
A: Mean is the only measure of central tendency that is always affected by an outlier. Mean, the…
Q: The National Football League (NFL) records a variety of performance data for individuals and teams.…
A: The independent variables are Yds/Att and Int/Att. The dependent variable is Win%. This is multiple…
Q: The five-number summary for a set of data is given below. Min Q1 Median Q3 Max 80 81 85 92 95 What…
A:

Step by step
Solved in 2 steps


- Hearing A researcher investigated four different wordlists for use in hearing assessment. She wanted to knowwhether the lists were equally difficult to understand inthe presence of a noisy background. To find out, she tested 96 subjects with normal hearing randomly assign-ing 24 to each of the four word lists and measured the number of words perceived correctly in the presence ofbackground noise. Here are the boxplots of the four lists: ANOVA Table Source DFSum ofSquaresMeanSquare F-Ratio P-ValueList 3 920.4583 306.819 4.9192 0.0033Error 92 5738.1667 62.371Total 95 6658.6250a) What are the null and alternative hypotheses?b) What do you conclude?c) Would it be appropriate to run a multiple comparisonstest (for example, a Bonferroni test) to see whichlists differ from each other in terms of mean percentcorrect? Explain.School system A school district superintendent wants totest a new method of teaching arithmetic in the fourth gradeat his 15 schools. He plans to select 8 students from eachschool to take part in the experiment, but to make sure theyare roughly of the same ability, he first gives a test to all120 students. Here are the scores of the test by school:The ANOVA table shows:Source DFSum ofSquaresMeanSquare F-Ratio P-ValueSchool 14 108.800 7.7714 1.0735 0.3899Error 105 760.125 7.2392Total 119 868.925a) What are the null and alternative hypotheses?b) What does the ANOVA table say about the nullhypothesis? (Be sure to report this in terms of scoresand schools.)c) An intern reports that he has done t-tests of everyschool against every other school and finds that severalof the schools seem to differ in mean score. Does thismatch your finding in part b? Give an explanation forthe difference, if any, of the two results.Computing Margin of Error: Confidence Interval for a Population Mean Assume that a sample is being used to estimate a population mean μ If n = 27, ¯x= 39, and s = 7, find the margin of error at a 95% confidence level. Give your answer to two decimal places.
- A researcher is interested in the texting habits of high school students in the United States. The researcher selects a group of 100 students, measures the number of text messages that each individual sends each day, and calculates the average number for the group. Identify the population for this study. Identify the sample for this study. The average number that the researcher calculated is an example of a --------.Tellers A bank is studying the time that it takes 6 of itstellers to serve an average customer. Customers line up inthe queue and then go to the next available teller. Here isa boxplot of the last 200 customers and the times it tookeach teller: ANOVA Table Source DFSum ofSquaresMeanSquare F-Ratio P-ValueTeller 5 3315.32 663.064 1.508 0.1914Error 134 58919.1 439.695Total 139 62234.4a) What are the null and alternative hypotheses?b) What do you conclude?c) Would it be appropriate to run a multiple comparisons test (for example, a Bonferroni test) to see which tell-ers differ from each other? Explain.Use test concerning Proportions: *A barangay captain claims that at least 85% of the residents in his barangay have household pets. To test this claim a researcher randomly selected a sample of 550 residents and find that 495 of them do have pets. What can you conclude at 0.10 level of significance.
- #14. Basic Computation: Coefficient of Variation, Chebyshev Interval Consider sample data with . Compute the coefficient of variation (CV#). Compute a 75% Chebyshev interval around he sample mean. x=15 s =3nterpret this interval. Select the correct choice below and fill in the answer boxes to complete your choice. (Type integers or decimals rounded to three decimal places as needed.) A. We are ____% confident that the every sample proportion of adults having a great deal or quite a lot of confidence in the public schools is between ____ and ___ B. There is a ___% chance that the population proportion of adults having a great deal or quite a lot of confidence in the public schools is between ___ and ___ C. There is a ___% chance that the sample proportion of adults having a great deal or quite a lot of confidence in the public schools is between ___ and ____ D. We are __% confident that the population proportion of adults having a great deal or quite a lot of confidence in the public schools is between ___ and ____a. A researcher interested in the texting habits of high school students in the United States. The researcher selects a group, of 100 students, measures the number of text message that each individual sends each day, and calculate. the average number for the group. Identify the population for this study. Identify the sample for this The average number that the researcher calculated is, an example of a --------·
- The average rating for a local hotel by 50 reviewers is 4.75 on a scale of 1 to 5. It is an example of inferential statistics because it summarizes the information in a sample. It is an example of inferential statistics because it uses a sample to make a claim about a population. It is an example of descriptive statistics because it summarizes the information in a sample. It is an example of descriptive statistics because it uses a sample to make a claim about a population.Biologists studying horseshoe crabs want to estimate the percent of crabs in a certain area that are longer than 35 centimeters. The biologists will select a random sample of crabs to measure. Which of the following is the most appropriate method to use for such an estimate? A one-sample z-interval for a population proportion A A one-sample z-interval for a sample proportion B A two-sample z-interval for a population proportion C A two-sample z-interval for a difference between population proportions D A two-sample z-interval for a difference between sample proportionsSampling from a subset of a population is an example of a _____________ Random Sample. The sum of the frequencies of the classes of a distribution is called the ______________ Frequency
