Find the mean of the data summarized in the given frequency distribution. Compare the computed mean to the actual mean of 51.3 degrees. Low Temperature ( o F) Frequency 40 – 44 45 - 49 50 – 54 55 - 59 60 – 64 D 3 12 7 1 The mean of the frequency distribution is degrees. (Round to the nearest tenth as needed.)
Q: Find the mean of the data summarized in the given frequency distribution. Compare the computed mean…
A: From the provided information, The frequency distribution table is as follow: Low Temperature…
Q: a. Find the mean of the data summarized in the given frequency distribution. Compare the computed…
A:
Q: Find the mean of the data summarized in the given frequency distribution. Compare the computed mean…
A: Given that The following table : Low Temperature frequency 40-44 3 45-49 5 50-54 11…
Q: =y 3 5
A: The given data is Low Temperature Frequency 40-44 3 45-49 5 50-54 9 55-59 4 60-64 1
Q: The table below gives the number of accidents each year at a particular road intersection: 2007 4…
A:
Q: Find the mean of the data summarized in the given frequency distribution. Compare the computer mean…
A:
Q: Find the mean of the data summarized in the given frequency distribution. Compare the computed mean…
A:
Q: The table displays the scores of students on a recent exam. Find the mean of the scores to the…
A: Given: Scores obtain by different students. To find: Mean of the scores. Mean is given by formula:…
Q: The amount of caffeine in a sample of five-ounce servings of brewed coffee is shown in the…
A: The complete table is, Frequency(f) Midpoint(x) xf 2 70.5 141 13 92.5 1,202.5 24 114.5…
Q: Find the mean of the data summarized in the given frequency distribution. Compare the computed mean…
A:
Q: The gas mileages (in miles per gallon) for 24 cars are shown in the frequency distribution.…
A: From the provided information, The frequency distribution table is as follow: Gas Mileage (in…
Q: Find the mean of the data summarized in the given frequency distribution. Compare the computed mean…
A: These are the inclusive type classes first we will change them to exclusive class intervals by…
Q: Find the mean of the data summarized in the given frequency distribution. Compare the computed mean…
A:
Q: The table on the right gives the annual income for eight families, in thousands of dollars. Find the…
A: Given that following data Family Income x A 49 B 51 C 46 D 48 E 47 F 48 G 45 H 50…
Q: deviation, mean deviation, standard deviation, and variance. Class interval Frequency 25 – 29…
A:
Q: Find the mean of the data summarized in the given frequency distribution. Compare the computed mean…
A:
Q: For the data shown, answer the questions. x 11.1 16.1 26.4 15.2 10.9 Find the mean: Find the…
A:
Q: Find the mean of the data summarized in the given frequency distribution. Compare the computed mean…
A: Given the Inclusive classes. Lower boundary(LB)=Lower Limit(LL)-(1/2) Upper boundary(UB)=Upper…
Q: The amount of caffeine in a sample of five-ounce servings of brewed coffee is shown in the…
A:
Q: Find the mean of the data summarized in the given frequency distribution. Compare the computed mean…
A: Low Temeperature Frequency (f) Midpoint (x) f*x 40-44 2 42 84 45-49 5 47 235 50-54 12 52 624…
Q: a) For the frequency distribution, below, find the relative frequency Xị Frequency Relative…
A: Solution: a. The given frequency distribution is
Q: The time (in minutes per day) spent on social media of a random sample of adults are shown in the…
A: We have given that data Time (minutes per day) Frequency 1 – 99 25 100 – 199 16…
Q: Assume that the red blood cell counts of women are normally distributed with a mean of 4.577 million…
A: Let x be the red blood cell counts of women which follows normal distribution with mean 4.577…
Q: nd the mean of the data summarized in the given frequency distribution. Compare the computed mean to…
A: The midpoint is, Speed Frequency midpoint fx 42-45 21 42+45/2=43.5 913.5 46-49 13 47.5 617.5…
Q: Find the mean of the data summarized in the given frequency distribution. Compare the computed mean…
A: Given data: Speed (miles per hour) Frequency 42-45 21 46-49 15 50-53 7 54-57 3 58-61 1…
Q: Find the mean of the data summarized in the given frequency distribution. The heights of a group of…
A: Given frequency distribution is, Height frequency 70-71 1 72-73 8 74-75 13 76-77 8…
Q: The scores and their percent of the final grade for a statistics student are given. What is the…
A: The data shows the scores and their percent of the final grade for a statistics student.
Q: Find the mean of the data summarized in the given frequency distribution. Compare the computed mean…
A: So mean of the frequency distribution is 51.1 degrees.
Q: Find the mean of the data summarized in the given frequency distribution. Compare the computed mean…
A: The solution to the given question is explained below.
Q: The data below shows the sample of number of hours spent studying in the past week for 28 students.…
A:
Q: The gas mileages (in miles per gallon) for 2727 cars are shown in the frequency distribution.…
A: Given frequency distribution gas mileages for 27 cars is shown below To calculate the mean of the…
Q: The gas mileages (in miles per gallon) for 33 cars are shown in the frequency distribution.…
A: From the provided information, Gas Mileage (in miles per gallon) Frequency 28-33 13…
Q: Find the mean of the data summarized in the given frequency distribution. Compare the computed mean…
A: Consider the following table:-
Q: Find the mean of the data summarized in the given frequency distribution. Compare the computed mean…
A: Low temperature Frquency (f) Midpoint (x) f*x 40-44 3 42 126 45-49 5 47 235 50-54 9 52 468…
Q: Find the mean of the data summarized in the given frequency distribution. Compare the computed mean…
A: Here we need to find the mean of the grouped data. We have , Mean = ∑f×m∑f Where f…
Q: Use the data below to answer the questions that follow. Score X-X 15 -3 17 -1 19 1 21 3 12. The…
A:
Q: Here is a frequency distribution table (FDT) for a small data set: frequency 14 data value 49 50 18…
A: Calculations for the measures of central tendency S.No. x f cf fx 1 49 14 14 686 2 50 18…
Q: Low Temperature ( o F) | 40– 44 45–49 4 Find the mean of the data summarized in the given frequency…
A: 40-44 1 42 42 45-49 4 47 188 50-54 12 52 624 55-59 5 57 285 60-64 1 62 62
Q: The table below gives the annual income for eight families, in thousands of dollars. Find the number…
A: Given : Family A B C D E F G H Income 51 53 52 50 49 50 47 48
Q: W At a site, the depth of the sand layer was measured for 10 points, and the results were as below,…
A: 1) The mean is given as Mean=sum of the valuestotal number of…
Q: Find the mean of the frequency distribution of the gas mileage (in miles per gallon) for 30 small…
A: We have given that the frequency distribution of the gas mileage( in miles per gallon ) for 30 small…
Q: Find the mean of the data summarized in the given frequency distribution. Compare the computed mean…
A:
Q: Find the mean for the data items in the given frequency distribution. 4. 6. Score, x Frequency, f 3…
A:
Q: The scores and their percent of the final grade for a statistics student are given. What is the…
A:
Q: The mean of a set of data is 4.68 and its standard deviation is 2.83. Find the z score for a value…
A: Reviewing information, Given, μ=mean=4.68σ=standard deviation=2.83x=9.38
Q: d) Find an estimate of the median score. e) Find the range of the middle 50% of the observations.…
A: Median is the middle most value i.e. the value that divides a distribution into two equal halves.…
Q: ind the mean of the data summarized in the given frequency distribution. Compare the computed mean…
A: Given data, Class Lower limit Upper limit Mid point(Mi) Frequency(fi) Mi*fi 42-45 42 45 43.5 25…
Q: Q.NO.1: a) For the following calculate mean deviation using median. Height No. of Boys 55 56 57 58…
A: Step 1: We have to find the mean deviation from median. for that we have to find median by drawing…
Q: Find the mean of the data summarized in the given frequency distribution. Compare the computed mean…
A: Solution: The given frequency distribution: Low Frequency Frequency Midpoint(x) fx 40- 44 2…
Q: The table on the right gives the annual income for eight families, in thousands of dollars. Find the…
A: given that n=8
attached - see image
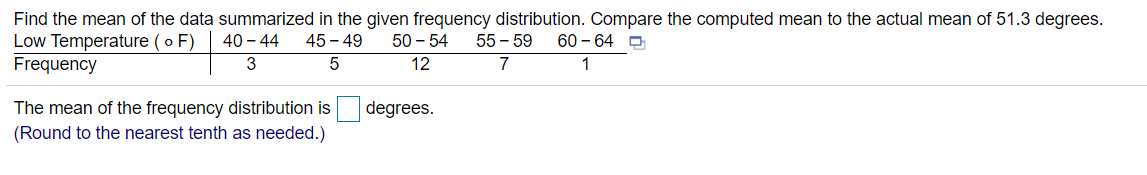
Trending now
This is a popular solution!
Step by step
Solved in 2 steps with 2 images