Find the range, variance and standard deviation of the following grouped data. 2. The following data represent the annual rainfall distribution in St. Louis, Missouri, for a sample of 25 years from 1870 to 2004. Rainfall (inches) | Number of Years 20 - 24 25 - 29 30 - 34 35 - 39 40 - 44 45 - 49 50 - 54 55 - 59 1
Find the range, variance and standard deviation of the following grouped data. 2. The following data represent the annual rainfall distribution in St. Louis, Missouri, for a sample of 25 years from 1870 to 2004. Rainfall (inches) | Number of Years 20 - 24 25 - 29 30 - 34 35 - 39 40 - 44 45 - 49 50 - 54 55 - 59 1

Glencoe Algebra 1, Student Edition, 9780079039897, 0079039898, 2018
18th Edition
ISBN:9780079039897
Author:Carter
Publisher:Carter
Chapter10: Statistics
Section10.5: Comparing Sets Of Data
Problem 4CYU

Related questions
Question
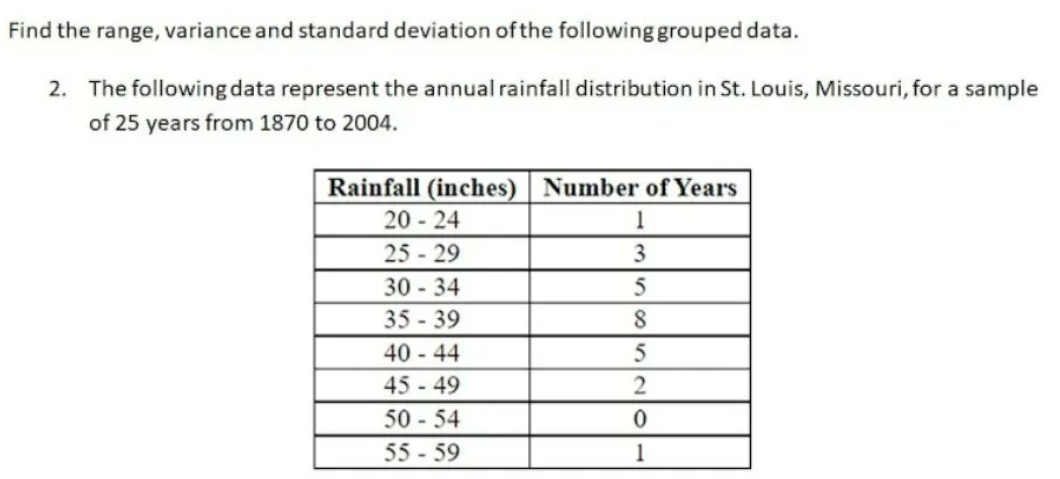
Transcribed Image Text:Find the range, variance and standard deviation of the following grouped data.
2. The following data represent the annual rainfall distribution in St. Louis, Missouri, for a sample
of 25 years from 1870 to 2004.
Rainfall (inches) Number of Years
20 - 24
25 - 29
30 34
1
3
35 39
40 - 44
5
45 49
2
50 54
55 59
1
Expert Solution
This question has been solved!
Explore an expertly crafted, step-by-step solution for a thorough understanding of key concepts.

Step by step
Solved in 2 steps with 2 images

Recommended textbooks for you
Glencoe Algebra 1, Student Edition, 9780079039897…
Algebra
ISBN:
9780079039897
Author:
Carter
Publisher:
McGraw Hill
Glencoe Algebra 1, Student Edition, 9780079039897…
Algebra
ISBN:
9780079039897
Author:
Carter
Publisher:
McGraw Hill