The accompanying data table lists the magnitudes of 50 earthquakes measured on the Richter scale. Test the claim that the population of earthquakes has a mean magnitude greater than 1.00. Use a 0.01 significance level. Identify the null hypothesis, alternative hypothesis, test statistic, P-value, and conclusion for the test. Assume this is a simple random sample. Click the icon to vi Magnitudes of 50 earthquakes What are the hypothese Ο Α. H μ= 1.00 in η H1:µ> 1.00 in r C. Ho: µ= 1.00 in r H1: µ#1.00 in r Magnitude of Earthquake 0.680 0.740 0.640 0.390 0.700 2.200 1.980 0.640 1.220 0.200 1.640 1.310 2.950 0.900 1.760 1.010 1.260 0.000 0.650 1.460 1.620 1.830 0.990 1.560 0.420 1.280 0.830 1.340 0.540 1.250 0.920 1.000 0.780 0.790 1.440 1.000 2.240 2.500 1.790 1.250 1.490 0.840 1.420 1.000 1.250 1.420 1.350 0.930 0.400 1.390
The accompanying data table lists the magnitudes of 50 earthquakes measured on the Richter scale. Test the claim that the population of earthquakes has a mean magnitude greater than 1.00. Use a 0.01 significance level. Identify the null hypothesis, alternative hypothesis, test statistic, P-value, and conclusion for the test. Assume this is a simple random sample. Click the icon to vi Magnitudes of 50 earthquakes What are the hypothese Ο Α. H μ= 1.00 in η H1:µ> 1.00 in r C. Ho: µ= 1.00 in r H1: µ#1.00 in r Magnitude of Earthquake 0.680 0.740 0.640 0.390 0.700 2.200 1.980 0.640 1.220 0.200 1.640 1.310 2.950 0.900 1.760 1.010 1.260 0.000 0.650 1.460 1.620 1.830 0.990 1.560 0.420 1.280 0.830 1.340 0.540 1.250 0.920 1.000 0.780 0.790 1.440 1.000 2.240 2.500 1.790 1.250 1.490 0.840 1.420 1.000 1.250 1.420 1.350 0.930 0.400 1.390

MATLAB: An Introduction with Applications
6th Edition
ISBN:9781119256830
Author:Amos Gilat
Publisher:Amos Gilat
Chapter1: Starting With Matlab
Section: Chapter Questions
Problem 1P

Related questions
Question
100%
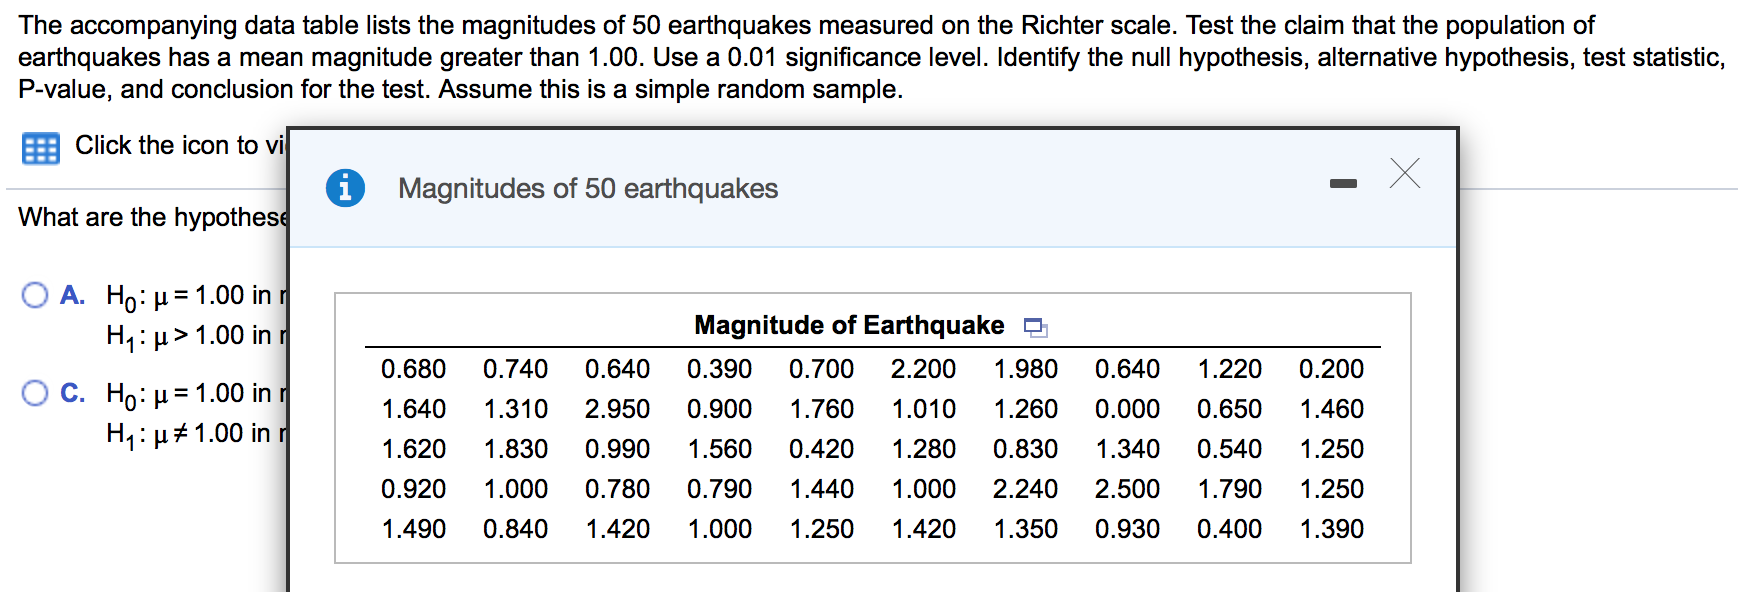
Transcribed Image Text:The accompanying data table lists the magnitudes of 50 earthquakes measured on the Richter scale. Test the claim that the population of
earthquakes has a mean magnitude greater than 1.00. Use a 0.01 significance level. Identify the null hypothesis, alternative hypothesis, test statistic,
P-value, and conclusion for the test. Assume this is a simple random sample.
Click the icon to vi
Magnitudes of 50 earthquakes
What are the hypothese
Ο Α. H μ= 1.00 in η
H1:µ> 1.00 in r
C. Ho: µ= 1.00 in r
H1: µ#1.00 in r
Magnitude of Earthquake
0.680
0.740
0.640
0.390
0.700
2.200
1.980
0.640
1.220
0.200
1.640
1.310
2.950
0.900
1.760
1.010
1.260
0.000
0.650
1.460
1.620
1.830
0.990
1.560
0.420
1.280
0.830
1.340
0.540
1.250
0.920
1.000
0.780
0.790
1.440
1.000
2.240
2.500
1.790
1.250
1.490
0.840
1.420
1.000
1.250
1.420
1.350
0.930
0.400
1.390
Expert Solution
This question has been solved!
Explore an expertly crafted, step-by-step solution for a thorough understanding of key concepts.

This is a popular solution!

Trending now
This is a popular solution!

Step by step
Solved in 3 steps with 2 images

Recommended textbooks for you
MATLAB: An Introduction with Applications
Statistics
ISBN:
9781119256830
Author:
Amos Gilat
Publisher:
John Wiley & Sons Inc

Probability and Statistics for Engineering and th…
Statistics
ISBN:
9781305251809
Author:
Jay L. Devore
Publisher:
Cengage Learning

Statistics for The Behavioral Sciences (MindTap C…
Statistics
ISBN:
9781305504912
Author:
Frederick J Gravetter, Larry B. Wallnau
Publisher:
Cengage Learning
MATLAB: An Introduction with Applications
Statistics
ISBN:
9781119256830
Author:
Amos Gilat
Publisher:
John Wiley & Sons Inc
Probability and Statistics for Engineering and th…
Statistics
ISBN:
9781305251809
Author:
Jay L. Devore
Publisher:
Cengage Learning
Statistics for The Behavioral Sciences (MindTap C…
Statistics
ISBN:
9781305504912
Author:
Frederick J Gravetter, Larry B. Wallnau
Publisher:
Cengage Learning

Elementary Statistics: Picturing the World (7th E…
Statistics
ISBN:
9780134683416
Author:
Ron Larson, Betsy Farber
Publisher:
PEARSON

The Basic Practice of Statistics
Statistics
ISBN:
9781319042578
Author:
David S. Moore, William I. Notz, Michael A. Fligner
Publisher:
W. H. Freeman

Introduction to the Practice of Statistics
Statistics
ISBN:
9781319013387
Author:
David S. Moore, George P. McCabe, Bruce A. Craig
Publisher:
W. H. Freeman