Fiure A Figure C From: "Why our flu vaccines can't keep up" Which one of the graphs shows the frequency of trait variation in the surviving sparrow population after the storm.?
Fiure A Figure C From: "Why our flu vaccines can't keep up" Which one of the graphs shows the frequency of trait variation in the surviving sparrow population after the storm.?

Biology 2e
2nd Edition
ISBN:9781947172517
Author:Matthew Douglas, Jung Choi, Mary Ann Clark
Publisher:Matthew Douglas, Jung Choi, Mary Ann Clark
Chapter19: The Evolution Of Populations
Section: Chapter Questions
Problem 19CTQ: Describe a situation in which a population would undergo the bottleneck effect and explain what...

Related questions

Topic Video
Question
Transcribed Image Text:Fligure A
Figure C
3:
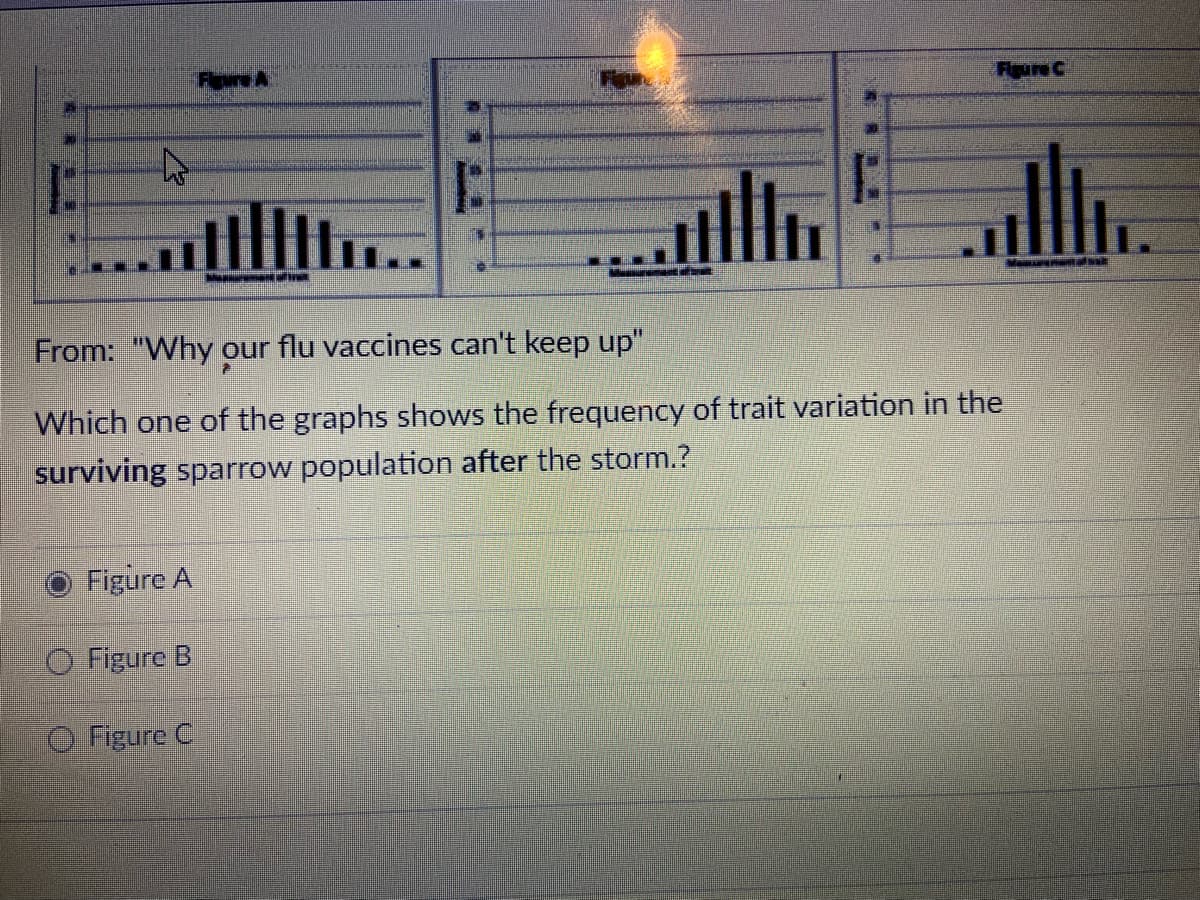
From: "Why our flu vaccines can't keep up"
Which one of the graphs shows the frequency of trait variation in the
surviving sparrow population after the storm.?
Figure A
O Figure B
e Figure C
Expert Solution
Step 1
Answer:

Trending now
This is a popular solution!

Step by step
Solved in 2 steps with 1 images

Knowledge Booster


Learn more about
Need a deep-dive on the concept behind this application? Look no further. Learn more about this topic, biology and related others by exploring similar questions and additional content below.Recommended textbooks for you
Biology 2e
Biology
ISBN:
9781947172517
Author:
Matthew Douglas, Jung Choi, Mary Ann Clark
Publisher:
OpenStax

Biology 2e
Biology
ISBN:
9781947172517
Author:
Matthew Douglas, Jung Choi, Mary Ann Clark
Publisher:
OpenStax