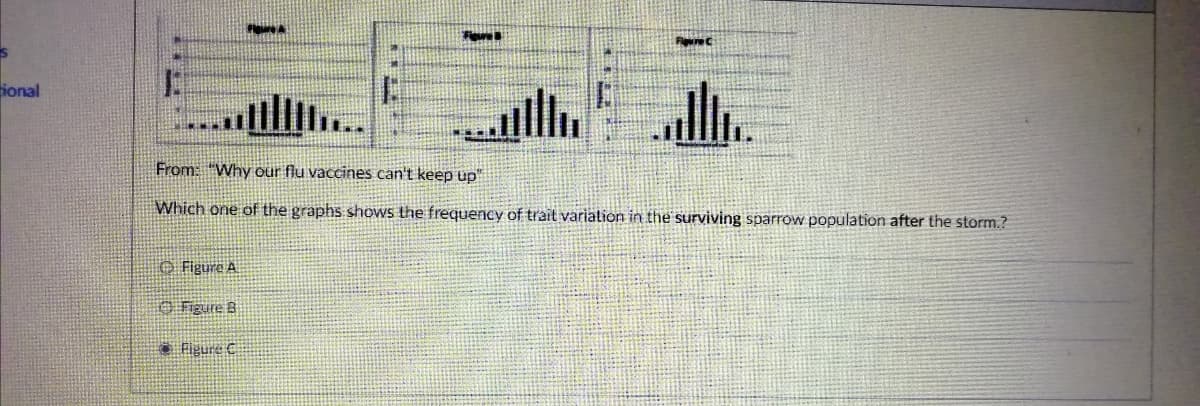
Feure .... From: "Why our flu vaccines can't keep up" Which one of the graphs shows the frequency of trait varialion in the surviving sparrow population after the storm.?


Genetic Variation
Genetic variation refers to the variation in the genome sequences between individual organisms of a species. Individual differences or population differences can both be referred to as genetic variations. It is primarily caused by mutation, but other factors such as genetic drift and sexual reproduction also play a major role.
Quantitative Genetics
Quantitative genetics is the part of genetics that deals with the continuous trait, where the expression of various genes influences the phenotypes. Thus genes are expressed together to produce a trait with continuous variability. This is unlike the classical traits or qualitative traits, where each trait is controlled by the expression of a single or very few genes to produce a discontinuous variation.
What conclusions can you draw about influenza vaccination cross-reactivity?

Trending now
This is a popular solution!

Step by step
Solved in 2 steps


