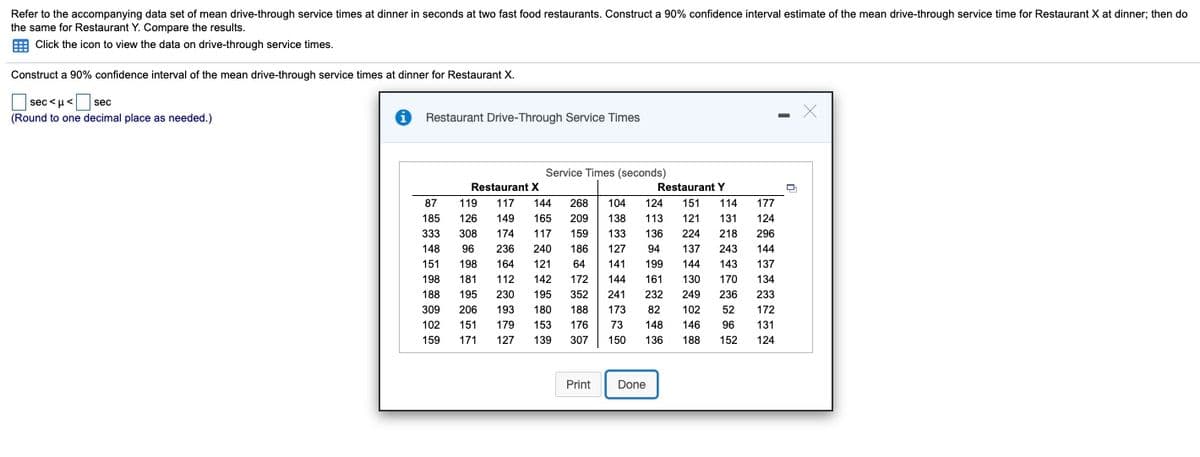
For both X and Y Restaurant X 87 119 117 144 268 185 126 149 165 209 333 308 174 117 159 148 96 236 240 186 151 198 164 121 64 198 181 112 142 172 188 195 230 195 352 309 206 193 180 188 102 151 179 153 176 159 171 127 139 307 Restaurant Y 104 124 151 114 177 138 113 121 131 124 133 136 224 218 296 127 94 137 243 144 141 199 144 143 137 144 161 130 170 134 241 232 249 236 233 173 82 102 52 172 73 148 146 96 131 150 136 188 152 124
For both X and Y Restaurant X 87 119 117 144 268 185 126 149 165 209 333 308 174 117 159 148 96 236 240 186 151 198 164 121 64 198 181 112 142 172 188 195 230 195 352 309 206 193 180 188 102 151 179 153 176 159 171 127 139 307 Restaurant Y 104 124 151 114 177 138 113 121 131 124 133 136 224 218 296 127 94 137 243 144 141 199 144 143 137 144 161 130 170 134 241 232 249 236 233 173 82 102 52 172 73 148 146 96 131 150 136 188 152 124
Glencoe Algebra 1, Student Edition, 9780079039897, 0079039898, 2018
18th Edition
ISBN:9780079039897
Author:Carter
Publisher:Carter
Chapter10: Statistics
Section10.3: Measures Of Spread
Problem 1GP
Related questions
Question
For both X and Y
| Restaurant X |
| 87 |
| 119 |
| 117 |
| 144 |
| 268 |
| 185 |
| 126 |
| 149 |
| 165 |
| 209 |
| 333 |
| 308 |
| 174 |
| 117 |
| 159 |
| 148 |
| 96 |
| 236 |
| 240 |
| 186 |
| 151 |
| 198 |
| 164 |
| 121 |
| 64 |
| 198 |
| 181 |
| 112 |
| 142 |
| 172 |
| 188 |
| 195 |
| 230 |
| 195 |
| 352 |
| 309 |
| 206 |
| 193 |
| 180 |
| 188 |
| 102 |
| 151 |
| 179 |
| 153 |
| 176 |
| 159 |
| 171 |
| 127 |
| 139 |
| 307 |
|
Restaurant Y |
| 104 |
| 124 |
| 151 |
| 114 |
| 177 |
| 138 |
| 113 |
| 121 |
| 131 |
| 124 |
| 133 |
| 136 |
| 224 |
| 218 |
| 296 |
| 127 |
| 94 |
| 137 |
| 243 |
| 144 |
| 141 |
| 199 |
| 144 |
| 143 |
| 137 |
| 144 |
| 161 |
| 130 |
| 170 |
| 134 |
| 241 |
| 232 |
| 249 |
| 236 |
| 233 |
| 173 |
| 82 |
| 102 |
| 52 |
| 172 |
| 73 |
| 148 |
| 146 |
| 96 |
| 131 |
| 150 |
| 136 |
| 188 |
| 152 |
| 124 |

Transcribed Image Text:Refer to the accompanying data set of mean drive-through service times at dinner in seconds at two fast food restaurants. Construct a 90% confidence interval estimate of the mean drive-through service time for Restaurant X at dinner; then do
the same for Restaurant Y. Compare the results.
E Click the icon to view the data on drive-through service times.
Construct a 90% confidence interval of the mean drive-through service times at dinner for Restaurant X.
|sec <u<
sec
(Round to one decimal place as needed.)
Restaurant Drive-Through Service Times
Service Times (seconds)
Restaurant X
Restaurant Y
87
119
117
144
268
104
124
151
114
177
185
126
149
165
209
138
113
121
131
124
333
308
174
117
159
133
136
224
218
296
96
236
198
148
240
186
127
94
137
243
144
151
164
121
64
141
199
144
143
137
198
181
112
142
172
144
161
130
170
134
188
195
230
195
352
241
232
249
236
233
309
206
193
180
188
173
82
102
52
172
102
151
179
153
176
73
148
146
96
131
159
171
127
139
307
150
136
188
152
124
Print
Done
Expert Solution
This question has been solved!
Explore an expertly crafted, step-by-step solution for a thorough understanding of key concepts.
This is a popular solution!
Trending now
This is a popular solution!
Step by step
Solved in 2 steps

Knowledge Booster
Learn more about
Need a deep-dive on the concept behind this application? Look no further. Learn more about this topic, probability and related others by exploring similar questions and additional content below.Recommended textbooks for you

Glencoe Algebra 1, Student Edition, 9780079039897…
Algebra
ISBN:
9780079039897
Author:
Carter
Publisher:
McGraw Hill

Glencoe Algebra 1, Student Edition, 9780079039897…
Algebra
ISBN:
9780079039897
Author:
Carter
Publisher:
McGraw Hill