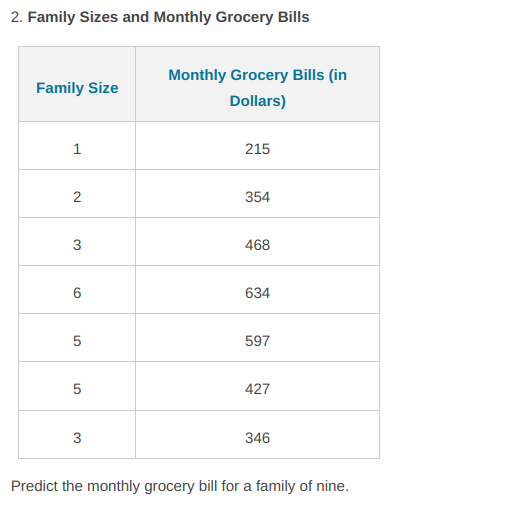
For each of the following data sets, construct a scatter plot, draw a line of best fit, use two points to find the equation for the line, and predict the specified future value.


Q: The following data relates to the gross value of output of a factory over the last few years: Year…
A: Given data, The following data relates to the gross value of output of a factory over the last few…
Q: Figure 1 reports a scatter plot of hhinc (horizontal axis) and size (vertical axis). Do you see any…
A: Given :
Q: ceferring to Table 12-11, which of the following is the correct alternative hypothesis for testing…
A: For testing the linear relationship- H0:beta1=0
Q: Fit a straight line trend to the following data by the method of least square. Years 1990| 1991|…
A: Here total number of observations is 6. n = 6
Q: Below is a scatter plot with both a linear model and an exponential model for another group's data…
A: Note: Hi there! Thank you for posting the question. As your question has more than 3 parts, we have…
Q: A random sample of ten professional athletes produced the following data where x is the number of…
A: The provided data set is:
Q: For each of the three plots, identify the strength of the relationship (e.g. weak, moderate, or…
A: 3.a From the figure we can see that one variable decreases with increase of another variable and…
Q: A study of bone density on 55 random women at a hospital produced the following results. Age 33 45…
A:
Q: For each of the following data sets, construct a scatter plot, draw a line of best fit, use two…
A:
Q: The following data show the quarterly sales of a major auto manufacturer for the years 1 through 3.…
A: We have to solve question no 28 28) what is the average seasonal index for quarter 1
Q: vt 14. Calculate trend values by the method of Least Square from the data given below 4. and…
A:
Q: The three-period moving average for the third quarter of 2012 (rounded off to two decimals) is:…
A: The sales for first quarter in 2012 is 110, second quarter is 131, and third quarter is 133.
Q: The following data show the quarterly sales of a major auto manufacturer for the years I through 3.…
A: Ans : As from the given data , We have our answers Q. 26) C Ans : Sales = 567 + 150(4) = 1167 Which…
Q: Given the following sales data, if there is no trend in the data a. What are the average seasonality…
A: Given the sales data as Year Quarter Sales 1 1 20 2 25 3 35 4 44
Q: Suppose we want to understand the relationship between Fat content (X1) and Saturated Fat content…
A: a) Let us consider the regression equation as Y=β0+β1X1+β2X2 Consider,…
Q: 9. For each of the following, indicate whether the data are cross-sectional or time-series: (A)…
A:
Q: Consider the following data: 1 1.6 2.9 3. 4.1 4.4 5.8 6.5 7.1 7.2 7.5 y 3. 3.3 4 4.1 4.8 5.4 5.6 5.9…
A: Hi! Thank you for the question, As per the honor code, we are allowed to answer three sub-parts at a…
Q: B/Fit a straight line to the data given below. Also estimate the value of y at x-2.5. 3 4. 1.8 3.3…
A: Normal equations are as below : Given values :
Q: Find the average of quarterly trend values for the given years from the data given below: Year…
A: introduction Form the data give in the table we have to find the average of quarterly trend…
Q: * For the following table: () Fit a straight line trend by the method of least squares. (ii)…
A:
Q: Fit a straight line equation by the method of least square for the following imaginary data relating…
A:
Q: By plotting the graph of the given data mention whether there is a positive trend, negative trend or…
A: The graph of the given data can be obtained using excel steps as follow: Enter the data into excel…
Q: Question 3 Consider the following data: Month Bicycles Sold 21.6 2 22.9 25.5 4 21.9 23.9 6. 27.5 7…
A: The simple linear equation is given by yi=β0 + β1xi + εi i=1,2....,nwhere yi= ith observation…
Q: Also Fit a trend line to the following data by the method of semi averages. draw the curve for both…
A:
Q: For the data points in question number 5: What is the value for r2 for the best fit curve?
A: Given the scatter diagram containing 8 data points. x y -5.5 -8 -4.9 -5.3 -3.7 -3.2 -2…
Q: 1.Use the least square method to develop a linear trend equation for the data from illustration 1.…
A:
Q: Compare the two models based on the forecast errors. Which is the appropriate model to use? Why?…
A: Given the data as Time (t) Sales Seasonally adjusted linear trend (Ft/s) 1 184 222.25 2…
Q: Question 4 Consider the below data set. Months 1 2 3 4 5 6 7 8 9 10 11 12 Demand 74 76 74 99 93 94…
A: Given information: Months Demand 1 74 2 76 3 74 4 99 5 93 6 94 7 63 8 92 9 62…
Q: Below are given the annual production figures (in thousand tonnes) Fertiliser factory: Year 2011…
A:
Q: A used car company believes that there is a relationship between the amount spent on advertising and…
A: In order to get the scatter plot, we use R, Let x denote the "Amount spent on advertising" and y…
Q: The following table gives the amount spent on cellular service. Cellular service revenue Date (in…
A: The given table: Let t be the number of years since 2011. That is, In 2011: t=0…
Q: Amex PLC has gathered following information on the sales of tace mask fPom Api September 2020. Month…
A: Let months following April be denoted by 1, 2, 3 and so on. And
Q: Construct a scatter plot of the data in the table AND create a linear model. 2 10 12 10 14 14 16 18…
A: The required scatter plot is:
Q: Final Grade in
A:
Q: Find the regression equations from the following data : Age of husband : 18 19 20 21 22 23 24 25 26…
A:
Q: For the data set, perform a 3 month moving average to determine the forecast for month 13. Show all…
A: From the given information, thirteen months rate was given. The forecasted value of month 13 is need…
Q: Suppose that you are given the following sales data for the last three years, with Q1 being Quarter…
A:
Q: If the value of D40 is 82, therefore, ____ of the data is less than or equal to 82.
A: Given a statement, we have to fill the blank of the statement.
Q: A neurologist wishes to determine if age affects how quickly a person reacts in a stressful…
A: According to the answering guidelines, we can answer only three subparts of a question and the rest…
Q: Fit a straight line trend by the method of least squares to the following data. Assurming the sarme…
A: Let X be the year Y be the Sales
Q: The following data set is scaled scores from the SAT test in 2018: Student 1: 500 Student 2: 580…
A: Solution Given data is the SAT score of the student on the scale 200 to 800.
Q: Which of the equations best represents the trend line for the data in the scatter plot? C = 150L +…
A:
Q: Step 1 of 2 : What would be your expected salary with no education and no experience?
A:
Q: - Question 17 Which of the following lines would be the best fit for the data points plotted in the…
A:
Q: The following scatter plot has a linear relationship. O True O False
A: Explanation of the answer is as follows
Q: If a forecaster wanted to choose a forecasting model that avoided having a large forecasting error…
A: If a forecaster wanted to choose a forecasting model to avoid a large forecasting error , we we use…
Q: Below are given the annual production figures (in thousand tonnes) of a fertiliser factory: Year…
A: Solution :-
Q: Under what circumstances would the trendline be significantly deviated by an outlier?
A: A trendline is the line that depicts the pattern of the data or the direction in which the data is…
Q: Which of the following indicates that a data set can be modelled using a linear function?
A: Let a data set is given as {a1, a2, a3, ...... } This data set is linear if a2-a1 = a3-a2 = .......…
Q: By plotting the graph of the given data mention whether there is a positive trend, negative trend or…
A: The graph for the data can be plot using Minitab: Open the Minitab sheet and enter the data of Xi…
For each of the following data sets, construct a

Step by step
Solved in 3 steps with 2 images

- A soda can has a volume of 25 cubic inches. Let x denote its radius and h its height, both in inches. a. Using the fact that the volume of the can is 25 cubic inches, express h in terms of x. b. Express the total surface area S of the can in terms of x.Details: A semiconductor manufacturing process creates an average of 0.4 defects per integrated circuit (chip), with the defects occurring independently of each other.Construct a hypothesis addressing which potato piece will have the greatest surface-area-to-volume ratio. Explain. Table 1a Why Are Cells Small Length (l) (cm) Width (w) (cm) Height (h) (cm) Size of Cross Section (h x w) (cm) Distance Traveled by IKI from Potato Edge (cm) Area of White Region (l x w) (cm) 2.50 2.50 2.50 6.25 cm 0.20 cm 2.64 cm 2.00 2.00 1.00 2.00cm 0.30 cm 1.87 cm 1.50 1.50 1.50 2.25 cm 0.50 cm 1.50 cm 1.00 1.00 1.00 1.00 cm 0.40 0.60 cm 2.00 0.50 0.50 0.25 cm 0.20 cm 0.15 cm 0.50 0.50 0.50 0.25 cm 0.30 cm 0.10 cm
- 1) Malaria is a disease that destroys red blood cells (the parasite invades red blood cells, multiplies, and then infects more red blood cells). In a recent study (Kotepul, et al., 2015) looking at various blood counts, the authors found the following results. Results are in billion red blood cells / cubic mm. Note that I have deliberately modified these results (do not use R): n ̄y s Low infection 527 4.16 2.23 High infection 157 4.51 2.34 Is there a difference in red blood cell count?(Hint: please think about this before you just start working on the problem!)84) plz help exhibit 10.16 is added in the pic Large-scale integrated (LSI) circuit chips are made in one department of an electronics firm. These chips are incorporated into analog devices that are then encased in epoxy. The yield is not particularly good for LSI manufacture, so the AQL specified by that department is 12% while the LTPD acceptable by the assembly department is 35%. Assume the company is willing to accept a consumer's risk of 10 percent and a producer's risk of 5 percent. a. Find the sample size. Use Exhibit 10.16; Note: If the exact value of the computed LTPD/AOQ ratio does not appear in Exhibit 10.16, use the next higher ratio. Note: Round up your answer to the next whole number. b. How would you tell someone to do the test? Randomly sample LSI using the sample size from part a, blank the lot if more than blank defective.The amt of pollution in waterways…
- How wellmaterials conduct heat matters when designing houses, forexample. Conductivity is measured in terms of watts of heatpower transmitted per square meter of surface per degree Celsius of temperature difference on the two sides of the material.The National Institute of Standards and Technology (NIST)provides data on properties of materials. Here are 9 NISTmeasurements of the heat conductivity of a particular type offibrous-glass board: 0.0339 0.0337 0.0334 0.0334 0.03330.0333 0.0333 0.0332 0.0330 (a) We can consider this an SRS of all specimens of fibrousglass board of this type. Make a stemplot. Is there any sign ofmajor deviation from Normality? (b) Give a 95% confidence interval for the mean conductivity. (c) Is there significant evidence at the 5% level that themean conductivity of this type of fibrous-glass board is not0.0330?In relation to an evaluation of a natural park you have collected data on the visitors, and obtaineddata for the travel costs and their zones of origin, i.e. basic data needed when applying the TravelCost Method.All visitors come by car and there’s only one person in each car. There are four different zones (Iclose, and IV most far away) and the total cost per person is given in the table below. Give a short explanation of the TCM. Would it be possible to do a reasonable TCM analysis from these data? Zone Travel cost per person($) Total population ineach zone Annual number ofvisitors from eachzone I 10 4000 400 II 15 3000 250 III 20 3500 410 IV 25 4000 450Coke is a solid fuel made by heating coal in the absence of air so that the volatile components are driven off. For screened coke, the porosity factor is measured by the difference in weight between dry and soaked coke. A certain supply of screened coke from a supplier is claimed to have a porosity factor of 1.8 kilograms. Ten samples of the screened coke obtained from this supplier are tested for porosity factors and the results are as follows : 1.7 , 1.9 , 1.8 , 1.9 , 2.1 , 2.1 , 2.0 , 1.8 , 1.7 , 2.0 . Is there sufficient evidence to indicate that the actual coke from the supplier is more porous than what is claimed? Use Assume that the porosity factor is a normally distributed variable. Use the following format in your presentation. Show the values of the mean and the standard deviation which you calculate using the formulas or directly through your calculator stat or through Excel. Ho : HA : Test Statistic Critical Value : Test Statistic Calculated Value : (show the…
- The sulfate ion concentration in natural water can be determined by measuring the turbidity that results when an excess of BaCl2 is added to a measured quantity of the sample. A turbiditimeter, the instrument used for this analysis, was calibrated with a series of standard Na2SO4 solutions. The following data were obtained for the calibration:The vulnerability of inshore environments to contamination due to urban and industrial expansion in Mombasa is discussed in the paper “Metals, Petroleum Hydrocarbons and Organo- chlorines in Inshore Sediments and Waters on Mombasa, Kenya” [Marine Pollution Bulletin (1997) 34:570–577]. A geochemical and oceanographic survey of the inshore waters of Mombasa, Kenya, was undertaken during the period from September 1995 to January 1996. In the survey, suspended particulate matter and sediment were collected from 48 stations within Mombasa’s estuarine creeks. The concentrations of major oxides and 13 trace elements were determined for a varying number of cores at each of the stations. In particular, the lead concentrations in sus-pended particulate matter (mg kg21 dry weight) were determined at 37 stations. The researchers were interested in determining whether the average lead concentration was greater than 30 mg kg21 dry weight. The data are given in the following table along with summary…The vulnerability of inshore environments to contamination due to urban and industrial expansion in Mombasa is discussed in the paper “Metals, Petroleum Hydrocarbons and Organo- chlorines in Inshore Sediments and Waters on Mombasa, Kenya” [Marine Pollution Bulletin (1997) 34:570–577]. A geochemical and oceanographic survey of the inshore waters of Mombasa, Kenya, was undertaken during the period from September 1995 to January 1996. In the survey, suspended particulate matter and sediment were collected from 48 stations within Mombasa’s estuarine creeks. The concentrations of major oxides and 13 trace elements were determined for a varying number of cores at each of the stations. In particular, the lead concentrations in sus-pended particulate matter (mg kg21 dry weight) were determined at 37 stations. The researchers were interested in determining whether the average lead concentration was greater than 30 mg kg21 dry weight. The data are given in the following table along with summary…

