For the accompanying data set, (a) draw a scatter diagram of the data, (b) compute the correlation coefficient, and (c) determine whether there is a linear relation between x and y. E Click the icon to view the data set. E Click the icon to view the critical values table. (a) Draw a scatter diagram of the data. Choose the correct graph below. OA. OB. Oc. OD. AY (b) Compute the correlation coefficient The correlation coefficient is r= (Round to three decimal places as needed.) (c) Determine whether there is a linear relation between x and y Because the correlation coefficient is and the absolute value of the correlation coefficient, is V than the critical value for this data set, linear relation exists between x and y. (Round to three decimal places as needed.)
For the accompanying data set, (a) draw a scatter diagram of the data, (b) compute the correlation coefficient, and (c) determine whether there is a linear relation between x and y. E Click the icon to view the data set. E Click the icon to view the critical values table. (a) Draw a scatter diagram of the data. Choose the correct graph below. OA. OB. Oc. OD. AY (b) Compute the correlation coefficient The correlation coefficient is r= (Round to three decimal places as needed.) (c) Determine whether there is a linear relation between x and y Because the correlation coefficient is and the absolute value of the correlation coefficient, is V than the critical value for this data set, linear relation exists between x and y. (Round to three decimal places as needed.)

Glencoe Algebra 1, Student Edition, 9780079039897, 0079039898, 2018
18th Edition
ISBN:9780079039897
Author:Carter
Publisher:Carter
Chapter4: Equations Of Linear Functions
Section4.5: Correlation And Causation
Problem 11PPS

Related questions
Question
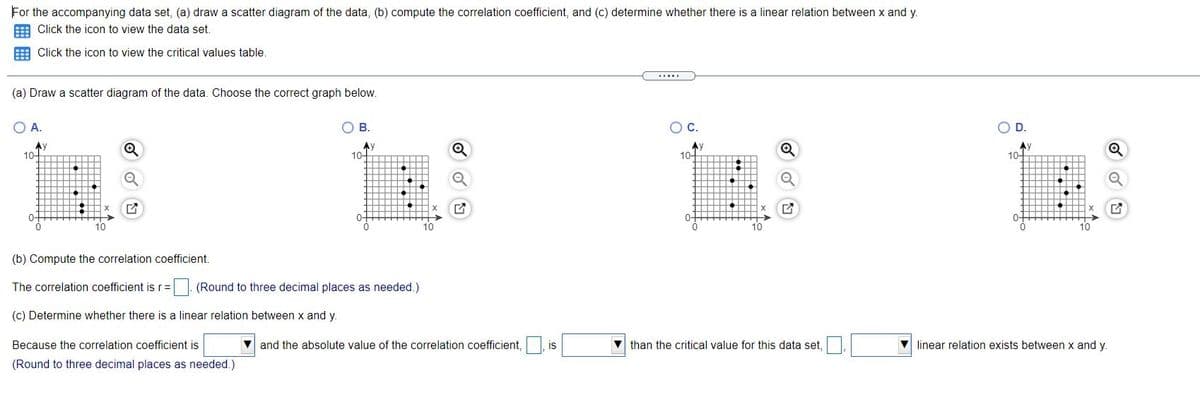
Transcribed Image Text:For the accompanying data set, (a) draw a scatter diagram of the data, (b) compute the correlation coefficient, and (c) determine whether there is a linear relation between x and y.
Click the icon to view the data set.
Click the icon to view the critical values table.
(a) Draw a scatter diagram of the data. Choose the correct graph below.
OA.
В.
Oc.
D.
Ay
10-
Ay
10-
Ay
10-
AV
10
0-
0-
0-
(b) Compute the correlation coefficient.
The correlation coefficient is r=| (Round to three decimal places as needed.)
(c) Determine whether there is a linear relation between x and y.
Because the correlation coefficient is
V and the absolute value of the correlation coefficient,
is
V than the critical value for this data set,
linear relation exists between x and y.
(Round to three decimal places as needed.)
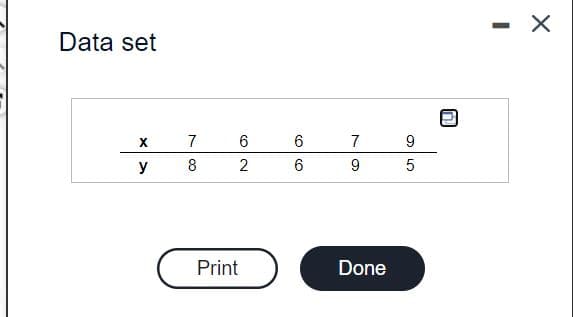
Transcribed Image Text:Data set
X
6
7
y
8
Print
Done
の|O
CO
7,
Expert Solution
This question has been solved!
Explore an expertly crafted, step-by-step solution for a thorough understanding of key concepts.

This is a popular solution!

Trending now
This is a popular solution!

Step by step
Solved in 4 steps with 3 images

Knowledge Booster


Learn more about
Need a deep-dive on the concept behind this application? Look no further. Learn more about this topic, statistics and related others by exploring similar questions and additional content below.Recommended textbooks for you
Glencoe Algebra 1, Student Edition, 9780079039897…
Algebra
ISBN:
9780079039897
Author:
Carter
Publisher:
McGraw Hill

Big Ideas Math A Bridge To Success Algebra 1: Stu…
Algebra
ISBN:
9781680331141
Author:
HOUGHTON MIFFLIN HARCOURT
Publisher:
Houghton Mifflin Harcourt
Glencoe Algebra 1, Student Edition, 9780079039897…
Algebra
ISBN:
9780079039897
Author:
Carter
Publisher:
McGraw Hill
Big Ideas Math A Bridge To Success Algebra 1: Stu…
Algebra
ISBN:
9781680331141
Author:
HOUGHTON MIFFLIN HARCOURT
Publisher:
Houghton Mifflin Harcourt