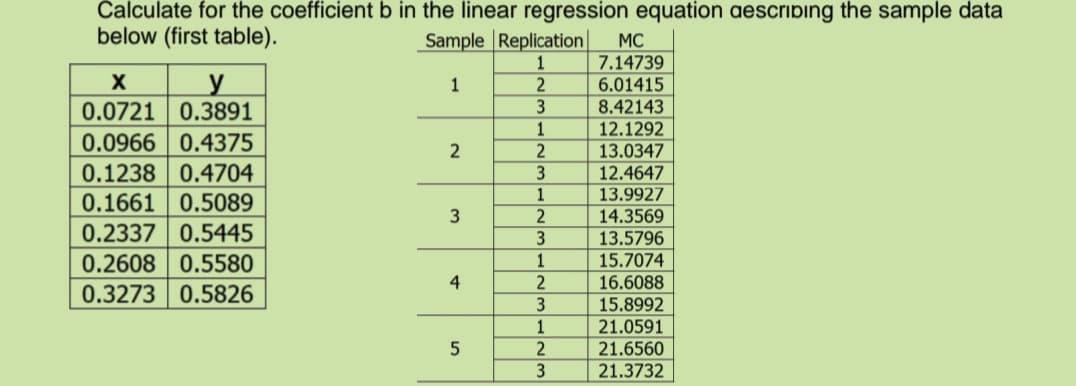
for the Coemcient in the linear ing the sample dala below (first table). Sample Replication MC 7.14739 6.01415 8.42143 12.1292 13.0347 0.0721 0.3891 1 0.0966 0.4375 0.1238 0.4704 0.1661 0.5089 0.2337 0.5445 0.2608 0.5580 3 12.4647 13.9927 14.3569 13.5796 15.7074 16.6088 15.8992 21.0591 21.6560 1 2 3 1 4 2 0.3273 0.5826 1 1.


Q: The following data represent petal lengths (in cm) for independent random samples of two species of…
A: (a) Use Ti 83 calculator to find the mean and standard deviation as follows: Select STAT > Edit…
Q: Which of the following studies would not be considered independent, random samples? Group of…
A: Independent samples: Independent samples are the samples which are randomly selected and its…
Q: The yields of a genetically modified wheat (in bushels per acre) were compared for five different…
A: As per Bartleby guidelines I can't answer more than three sub parts per post. Please post another…
Q: The summary of a randomized block experiment with four groups and eight blocks is given below in the…
A: From the given information, total number of groups c = 4. Total number of blocks r = 8. The ANOVA…
Q: A teller at a drive-up window at a bank had the following service times (in minutes) for 20 randomly…
A: Hello. Since your question has multiple sub-parts, we will solve first three sub-parts for you. If…
Q: The following values are from an independent-measures study comparing three treatment conditions. I…
A: The required variance for treatment I can be obtained as:
Q: The following data represent petal lengths (in cm) for independent random samples of two species of…
A: Note: " Since you have asked multiple sub-parts, we will solve the first three sub-parts for you. If…
Q: The following data represent petal lengths (in cm) for independent random samples of two species of…
A: Mean: It is one of the central tendency which is the average of the data, i.e) the ratio of the sum…
Q: An investigation of water plant growth compares the heights (inches) of species of plant growing in…
A: From the given information, Consider, the provided information is as given below: Mean…
Q: The following is sample information. We are asked to test the hypothesis at the 5% significance…
A:
Q: The following data represent petal lengths (in cm) for independent random samples of two species of…
A:
Q: The yields of a genetically-modified wheat (in bushels per acre) were compared for five different…
A: Null and alternative hypotheses: Null hypothesis is a nullified statement about population parameter…
Q: Is the average length of time to earn a doctorate different from one field to another? Independent…
A: (a). Identify the level of significance: Level of significance: Level of significance is the…
Q: The owner of Maumee Ford-Volvo wants to study the relationship between the age of a car and its…
A: 1) Since we want to estimate the selling price on the basis of the age of the car, which means that…
Q: The following data represent petal lengths (in cm) for independent random samples of two species of…
A: Note: Since you have posted a question with multiple subparts, we will solve the first three…
Q: 5. Astudent wanted to determine whether the wait time in the drive through at McDonald's differed…
A: a) The null and alternative hypothesis are : Ho : μ1=μ2H1 : μ1≠μ2 Let us assume that the population…
Q: Independent random samples are selected from two populations. Below are the sorted data from the…
A:
Q: he owner of Maumee Ford-Volvo wants to study the relationship between the age of a car and its…
A: Solution: Let X =Age( years) and Y = Selling Price ($000) X Y X2 Y2 XY 11 11 121 121 121 7…
Q: Independent random samples are selected from two populations. Below are the sorted data from the…
A:
Q: For the following two samples of scores, calculate the pooled variance from an Independent-Samples…
A:
Q: Spectators are interested to know if the ages of gymnasts competing in the Canada Games are…
A: Give that: Female Gymnasts Age Male Gymnasts Age 15 17 16 12 17 17 14 15 16 16 15 16…
Q: A researcher conducted a prospective cohort study from which all cases and a subset of controls…
A: Given Information: A researcher conducted a cohort study from which the cases and controls were…
Q: Two samples of video gamers have the following high sçores for their favorite video game. Calculate…
A:
Q: Find the value of the chi-square statistic for the sample. (Round the expected frequencies to at…
A: The following information has been provided. The row and column total have been calculated and they…
Q: The following data summarize the results from an independent-measures study comparing three…
A: Given:
Q: The summary of a randomized block experiment with four groups and eight blocks is given below in the…
A: FSTAT = 5.444 GIVEN
Q: The following data represent petal lengths (in cm) for independent random samples of two species of…
A: Given, The following data represent petal lengths (in cm) for independent random samples of two…
Q: Here is a random sample of turkey wight. Assume turkey weight is normally distributed. 15 16…
A: The data shows the turkey weights which is normally distributed. The claim is that the mean weight…
Q: To determine diet quality, male weanling rats were fed diets with various protein levels. Each of 15…
A: Please find the step by step solution below. Hope it will help. Thank you
Q: The following data represent petal lengths (in cm) for independent random samples of two species of…
A: For any given data Sample mean, x¯=∑xin, where n =sample size xi=ith observation for…
Q: Four experimenters determine the moisture content of samples of a powder, each man taking a sample…
A: Two way Analysis of Variance(ANOVA): 1] It compares the compares the mean differences between the…
Q: Listed below are the lead concentrations in ug/g measured in different traditional medicines. Use a…
A: We want to test the hypothesis.
Q: The owner of Maumee Ford-Volvo wants to study the relationship between the age of a car and Its…
A: The independent variable is Age. The dependent variable is Selling Price. We have to find the…
Q: Use the provided randomization distribution (based on 100 samples) to estimate the p-value for this…
A: From the provided information, Sample size (n) = 100 Sample mean (x̄) = 0.341 Sample standard…
Q: For the repeated-measures ANOVA, SSwithin treatments = _______. a. SSbetween treatments /…
A:
Q: he following data represent petal lengths (in cm) for independent random samples of two species of…
A: The Given samples: n1=36 x1= 5.2 5.8 6.1 6.1 5.1 5.5 5.3 5.5 6.9 5.0 4.9 6.0 4.8 6.1 5.6 5.1…
Q: With the generated sample using Simple Random Sampling, test for the hypothesis that the weight of…
A: If the population variance is assumed to be equal then t test with equal variance is used to compare…
Q: Members of fraternities and sororities are required to volunteer for community service. Do…
A: The objective of the study is to test whether fraternity brothers work fewer volunteer hours on…
Q: Q. 1 Independent random samples of 15 mid-western and 14 southern households provided the following…
A: t-test: If the given sample size is less than or equal to 30 then that is a small sample test.…
Q: Consider the data below. Three random samples in different cities were selected. Water use per…
A: Given : City 1 City 2 City 3 78 67 45 70 65 45 56 54 45 41 48 34 35 56 66 76 54 61 78 45
Q: The following information was obtained from bwo independent samples randomly selected from two…
A: We have given that, For sample 1:- n1 = 20 and n2 = 21 and s1 = 3.26, s2 = 3.78 Then, We will…
Q: The data in the table below are summary statistics of the daily output (in tonnes) of random,…
A: The data of 6 copper mines in Free States, 8 copper mines in Northern Cape and 6 copper mines in…
Q: The following data represent petal lengths (in cm) for independent random samples of two species of…
A: a. Enter the values of Petal length (in cm) of Iris virginica and Petal length (in cm) of Iris…
Q: 17. A researcher was interested in comparing the salaries of female and male employees at a…
A: Given data1- denotes Female2 – denotes Male
Q: The following data represent petal lengths (in cm) for independent random samples of two species of…
A: In this context, we are using T1-84 calculator to obtain the mean, standard deviation and 99%…
Q: Consider the data below. Three random samples in different cities were selected. Water use per…
A: Given Information: Consider the given dataset: City 1 City 2 City 3 70 66 66 70 64 66 55 45…
Q: Random samples that are drawn independently from two normally distributed populations yielded the…
A:
Q: Members of fraternities and sororities are required to volunteer for community service. Do…
A: Given: Brothers are taken as group 1 Sisters are taken as group 2 n1=13n2=11α=0.10
Q: Consider the data below. Three random samples in different cities were selected. Water use per…
A: Given information: The data of the three random samples of different cities regarding the…
Q: To determine diet quality, male weanling rats were fed diets with various protein levels. Each of 15…
A:

Step by step
Solved in 2 steps with 1 images

- Olympic Pole Vault The graph in Figure 7 indicates that in recent years the winning Olympic men’s pole vault height has fallen below the value predicted by the regression line in Example 2. This might have occurred because when the pole vault was a new event there was much room for improvement in vaulters’ performances, whereas now even the best training can produce only incremental advances. Let’s see whether concentrating on more recent results gives a better predictor of future records. (a) Use the data in Table 2 (page 176) to complete the table of winning pole vault heights shown in the margin. (Note that we are using x=0 to correspond to the year 1972, where this restricted data set begins.) (b) Find the regression line for the data in part ‚(a). (c) Plot the data and the regression line on the same axes. Does the regression line seem to provide a good model for the data? (d) What does the regression line predict as the winning pole vault height for the 2012 Olympics? Compare this predicted value to the actual 2012 winning height of 5.97 m, as described on page 177. Has this new regression line provided a better prediction than the line in Example 2?A manufacturer of car batteries claims that the mean lifetime of their battery is 67 months. Thinking that this claim is inflated, graduate students buy a random sample of 72 car batteries from this manufacturer. How should they proceed? a) Perform a hypothesis test of H0:μ=67 versus Ha:μ>67 b) Perform a hypothesis test of H0:μ=67 versus Ha:μ<67 c) Use Simple linear regression1a. Develop an estimated regression equation for these data. 1b. Compute the residuals and standardized residuals
- A sample of 40 individuals collects their shoe size and the height (cm) for CSI data. The scatter plot and results from a simple linear regression are recorded: HEIGHT = 126.76238 + 4.8782178 SHOE SIZE Sample size: 40R (correlation coefficient) = 0.77918855P-value < 0.0001 (a) Does the scatterplot and results show a linear correlation between shoe size and height? (b) How can you tell? (c) Will it be appropriate to use the linear regression equation given in the output? (d) Krusty the Clown wears size 8.5 shoes. According to the linear regression equation, how tall is Krusty the Clown? (e) Sideshow Bob wears size 14 shoes. According to the linear regression equation, how tall is Sideshow Bob?The average asking rent for 10 markets, and the corresponding monthly mortgage on the median priced home (including taxes and insurance) for 10 cities are given in Rent ($) Mortgage ($) City 1 840 539 City 2 1062 1002 City 3 823 626 City 4 779 711 City 5 796 655 City 6 1071 977 City 7 953 776 City 8 851 695 City 9 762 651 City 10 723 654 What is the simple linear regression model to predict the monthly mortgage on the median priced home, using average asking rent? Fill in the coefficient for the LINEAR independent variable (keep 2 decimal points).a) Calculate the least square regression line for X on Y of the given data?b) Calculate the coefficient of correlation of the given date? Interpret the value of the coefficient?
- Consider the fitted values from a simple linear regression model with intercept: yˆ = 7 + 4x. Assume that the total number of observations is n = 20. In addition, the explained sum of squares is SSE = 10 and the residual sum of squares is SSR = 30. Under the classical Gauss-Markov assumptions, a) What is the value of the R^2 ? b) What is the value of the adjusted R^2 ? c) What is the standard error of the regression? d) What is the standard error of the estimated slope coefficient? e) What is the value of the F test?Here there is a skewness and kurtosis test for residuals of a linear regression analysis. Interpret the values and histogram of residuals to check whether there is normal distribution. kurtosis n NADeveloped 0.349937 448 64Developing 3.469676 2010 416 kurtosis n NADeveloped 0.349937 448 64Developing 3.469676 2010 416Seven North American Green Frogs (Rana clamitans) had their jumping distance recorded (in mm) multiple times in a laboratory. The mean jumping distance for these frogs along with their length (measured from snout to vent in miMillimeters) are presented in the table below. Length of Frog 52 68 37 65 77 81 59 Mean Jumping Distance 546 673 415 659 793 814 563 (a) Determine the linear regression model that will best predit the mean jumping distance of a North American Green Frog based on the frog's length. (b) How well does the linear regression model fit this sample data? (c) Use the linear regression model to predict the mean jumping distance of a North American Green Frog that is 48 mm in length. No excel, please.
- A random sample of twelve students were chosen, and their midterm test score (y), as- signment score (x1), and missed classes (x2) were recorded as follows: Midterm Score, y Assignment Score, x1 Classes Missed, x2 85 74 76 90 85 87 94 98 81 91 76 74 65 50 55 65 55 70 65 70 55 70 50 55 5 7 5 2 6 3 2 5 4 3 1 4 (i) What is the fitted multiple linear regression equation of the form yˆ = b0 + b1x1 + b2x2? (ii) From part (i) above, estimate the midterm test score grade for a student who has an assignment score of 60 and missed 4 classes.The number of initial public offerings of stock issued in a 10-year period and the total proceeds of these offerings (in millions) are shown in the table. Construct and interpret a 95% prediction interval for the proceeds when the number of issues is 646. The equation of the regression line is y=32.824x+17,659.242. Issues, x 418 475 683 477 492 379 59 51 196 154 Proceeds, y 17,703 28,601 43,966 31,686 36,833 36,916 21,908 10,311 31,407 28,337 Construct and interpret a 95% prediction interval for the proceeds when the number of issues is 646. Select the correct choice below and fill in the answer boxes to complete your choice. (Round to the nearest million dollars as needed. Type your answer in standard form where "3.12 million" means 3,120,000.) A. We can be 95% confident that when there are 646 issues, the proceeds will be between $____ and $____. B. There is a 95% chance…A researcher would like to predict the dependent variable Y from the two independent variables X1 and X2 for a sample of N=15 subjects. Use multiple linear regression to calculate the coefficient of multiple determination and test the significance of the overall regression model. Use a significance level α=0.02. X1 X2 Y 55.1 69.4 72.2 31.4 54.3 36.2 57.9 50 103.4 41.3 53.7 43.9 50.7 36.6 98.5 50.1 53.3 65.3 39.8 60.5 55.2 59.6 80.8 43.6 24.2 8.2 77 32.4 69.8 31 34.4 35.3 82.6 70.3 79.6 66.2 31.5 36.1 43.6 42.3 48.7 73.3 25.9 70.2 21.6 SSreg=SSres= R2= F=P-value = What is your decision for the hypothesis test? Reject the null hypothesis, H0:β1=β2=0 Fail to reject H0 What is your final conclusion? The evidence supports the claim that one or more of the regression coefficients is non-zero The evidence supports the claim that all of the regression coefficients are zero There is insufficient evidence to support the claim that at least one of the…