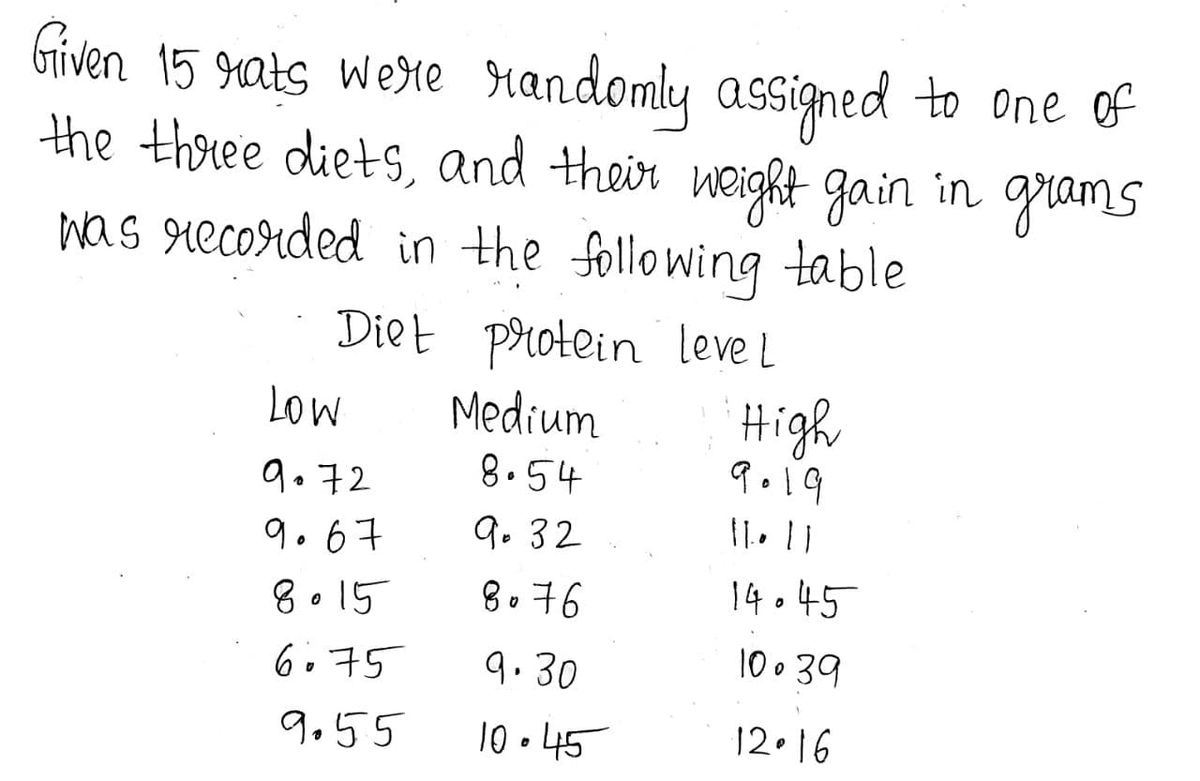
To determine diet quality, male weanling rats were fed diets with various protein levels. Each of 15 rats was randomly assigned to one of three diets, and their weight gain in grams was recorded in the following table: Diet protein level Low Medium High 9.72 8.54 9.19 9.67 9.32 11.11 8.15 8.76 14.45 6.75 9.30 10.39 9.55 10.45 12.16 Sample Mean Sample Variance 1.696 8.768 9.274 11.460 0.547 3.963 Suppose we fit the data with the following model: Xij = µ+a; + Eij, i= 1, 2, 3; j = 1,.,5, where a1 + a2 + a3 = 0 and ɛij N(0, o²) independently. Define X;. = }E Xij for j=1 i- 1,2, 3, Χ. Σ Σ X, and SS(E) ΣΣ(X- Χ. )?. Li=1Lj=1 %3D Some R output that may help. > p1 <- c(0.01, 0.025, 0.05, 0.1, 0.9, 0.95, 0.975, 0.99) > qf (p1, 2, 12) [1] 0.010 0.025 0.052 0.106 2.807 3.885 5.096 6.927 > qf (p1, 2, 14) [1] 0.010 0.025 0.051 0.106 2.726 3.739 4.857 6.515 > qf (p1, 3, 12) [1] 0.037 0.070 0.114 O.192 2.606 3.490 4.474 5.953 > qf (p1, 3, 14) [1] 0.037 0.070 0.115 0.192 2.522 3.344 4.242 5.564
To determine diet quality, male weanling rats were fed diets with various protein levels. Each of 15 rats was randomly assigned to one of three diets, and their weight gain in grams was recorded in the following table: Diet protein level Low Medium High 9.72 8.54 9.19 9.67 9.32 11.11 8.15 8.76 14.45 6.75 9.30 10.39 9.55 10.45 12.16 Sample Mean Sample Variance 1.696 8.768 9.274 11.460 0.547 3.963 Suppose we fit the data with the following model: Xij = µ+a; + Eij, i= 1, 2, 3; j = 1,.,5, where a1 + a2 + a3 = 0 and ɛij N(0, o²) independently. Define X;. = }E Xij for j=1 i- 1,2, 3, Χ. Σ Σ X, and SS(E) ΣΣ(X- Χ. )?. Li=1Lj=1 %3D Some R output that may help. > p1 <- c(0.01, 0.025, 0.05, 0.1, 0.9, 0.95, 0.975, 0.99) > qf (p1, 2, 12) [1] 0.010 0.025 0.052 0.106 2.807 3.885 5.096 6.927 > qf (p1, 2, 14) [1] 0.010 0.025 0.051 0.106 2.726 3.739 4.857 6.515 > qf (p1, 3, 12) [1] 0.037 0.070 0.114 O.192 2.606 3.490 4.474 5.953 > qf (p1, 3, 14) [1] 0.037 0.070 0.115 0.192 2.522 3.344 4.242 5.564

Holt Mcdougal Larson Pre-algebra: Student Edition 2012
1st Edition
ISBN:9780547587776
Author:HOLT MCDOUGAL
Publisher:HOLT MCDOUGAL
Chapter11: Data Analysis And Probability
Section11.5: Interpreting Data
Problem 1C

Related questions
Question
![To determine diet quality, male weanling rats were fed diets with various protein levels. Each
of 15 rats was randomly assigned to one of three diets, and their weight gain in grams was
recorded in the following table:
Diet protein level
Medium
Low
High
9.72
8.54
9.19
9.67
9.32
11.11
8.15
8.76
14.45
6.75
9.30
10.39
9.55
10.45
12.16
Sample Mean
Sample Variance 1.696
8.768
9.274
11.460
0.547
3.963
Suppose we fit the data with the following model:
Xij = µ+a; + Eij, i = 1, 2, 3; j= 1,., 5,
N(0, o²) independently. Define X;.
i = 1,2, 3, X. = 1=1 Xij, and SS(E) = E-1E=1(Xij – X;.)².
E- Xij for
where a1 + a2 + az =
0 and
Eij
Some R output that may help.
> p1 <- c(0.01, 0.025, 0.05, 0.1, 0.9, 0.95, 0.975, 0.99)
> qf (p1, 2, 12)
[1] 0.010 0.025 0.052 0.106 2.807 3.885 5.096 6.927
> qf (p1, 2, 14)
[1] 0.010 0.025 0.051 O.106 2.726 3.739 4.857 6.515
> qf (p1, 3, 12)
[1] 0.037 0.070 0.114 O.192 2.606 3.490 4.474 5.953
> qf (p1, 3, 14)
[1] 0.037 0.070 0.115 0.192 2.522 3.344 4.242 5.564](/v2/_next/image?url=https%3A%2F%2Fcontent.bartleby.com%2Fqna-images%2Fquestion%2F1076b49d-639e-46e6-94d5-ee66fa9d3246%2Ff4b62d6c-3162-46fc-9500-0adc3dc7dff4%2Fdu9523m_processed.png&w=3840&q=75)
Transcribed Image Text:To determine diet quality, male weanling rats were fed diets with various protein levels. Each
of 15 rats was randomly assigned to one of three diets, and their weight gain in grams was
recorded in the following table:
Diet protein level
Medium
Low
High
9.72
8.54
9.19
9.67
9.32
11.11
8.15
8.76
14.45
6.75
9.30
10.39
9.55
10.45
12.16
Sample Mean
Sample Variance 1.696
8.768
9.274
11.460
0.547
3.963
Suppose we fit the data with the following model:
Xij = µ+a; + Eij, i = 1, 2, 3; j= 1,., 5,
N(0, o²) independently. Define X;.
i = 1,2, 3, X. = 1=1 Xij, and SS(E) = E-1E=1(Xij – X;.)².
E- Xij for
where a1 + a2 + az =
0 and
Eij
Some R output that may help.
> p1 <- c(0.01, 0.025, 0.05, 0.1, 0.9, 0.95, 0.975, 0.99)
> qf (p1, 2, 12)
[1] 0.010 0.025 0.052 0.106 2.807 3.885 5.096 6.927
> qf (p1, 2, 14)
[1] 0.010 0.025 0.051 O.106 2.726 3.739 4.857 6.515
> qf (p1, 3, 12)
[1] 0.037 0.070 0.114 O.192 2.606 3.490 4.474 5.953
> qf (p1, 3, 14)
[1] 0.037 0.070 0.115 0.192 2.522 3.344 4.242 5.564
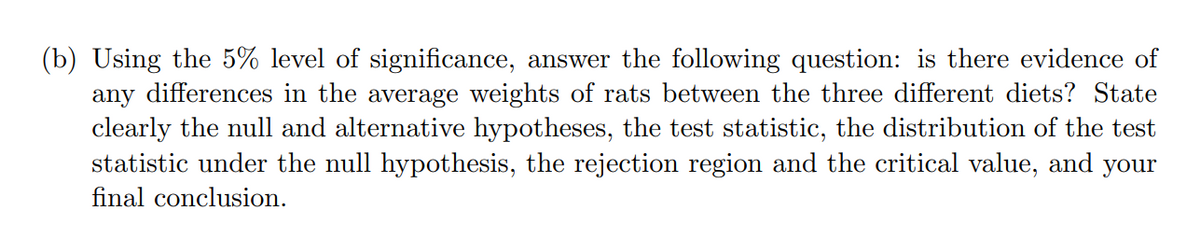
Transcribed Image Text:(b) Using the 5% level of significance, answer the following question: is there evidence of
any differences in the average weights of rats between the three different diets? State
clearly the null and alternative hypotheses, the test statistic, the distribution of the test
statistic under the null hypothesis, the rejection region and the critical value, and
final conclusion.
your
Expert Solution
Step 1

Step by step
Solved in 3 steps with 9 images

Recommended textbooks for you
Holt Mcdougal Larson Pre-algebra: Student Edition…
Algebra
ISBN:
9780547587776
Author:
HOLT MCDOUGAL
Publisher:
HOLT MCDOUGAL

College Algebra (MindTap Course List)
Algebra
ISBN:
9781305652231
Author:
R. David Gustafson, Jeff Hughes
Publisher:
Cengage Learning
Holt Mcdougal Larson Pre-algebra: Student Edition…
Algebra
ISBN:
9780547587776
Author:
HOLT MCDOUGAL
Publisher:
HOLT MCDOUGAL
College Algebra (MindTap Course List)
Algebra
ISBN:
9781305652231
Author:
R. David Gustafson, Jeff Hughes
Publisher:
Cengage Learning