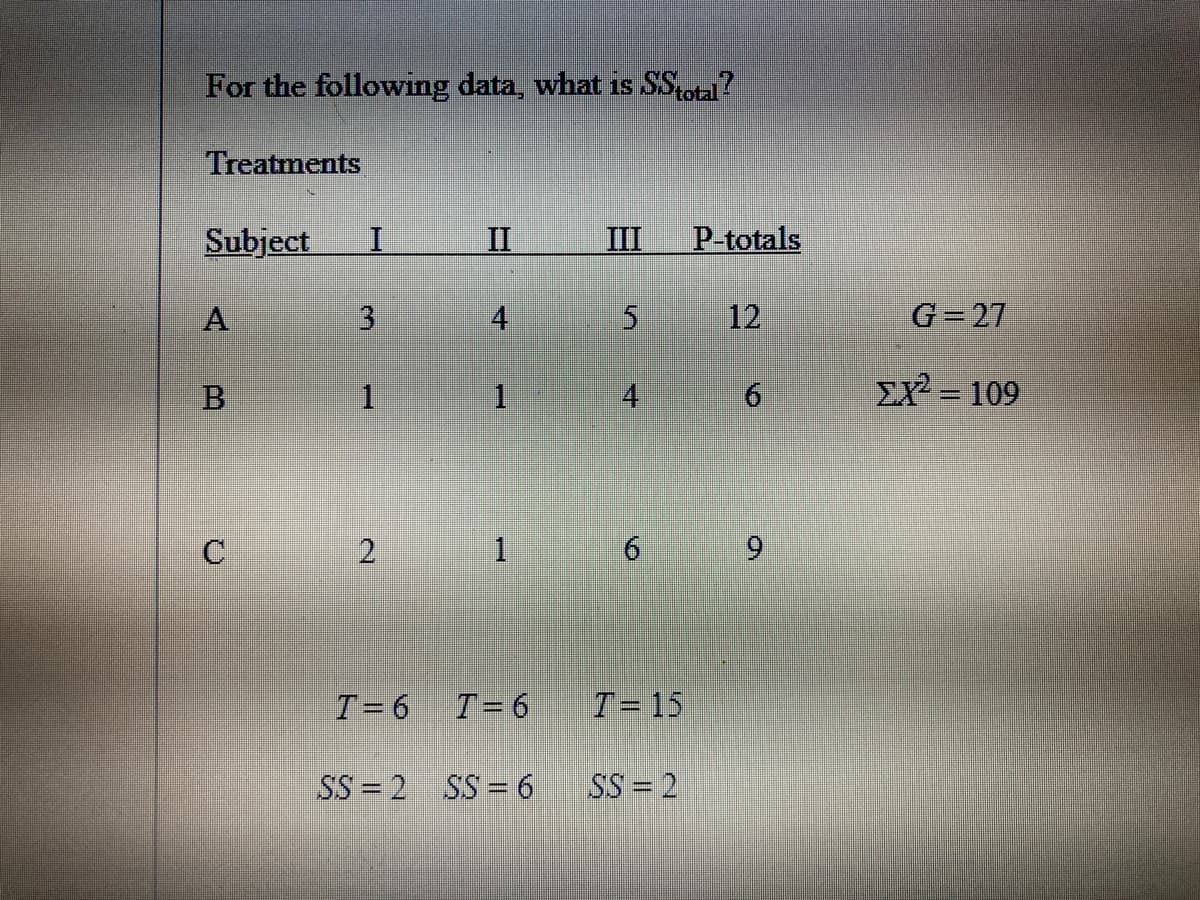
For the following data, what is SStotal? Treatments Subject II III P-totals A 4 12 G= 27 1 1 6. Σχ-109 %3D 1 6 9. T=6 T=6 T = 15 SS = 2 SS = 6 SS = 2 4, 3. 2. B.


Q: The following data were obtained from a repeated-measure research study. What is the value of MD for…
A: The following data were obtained from a repeated-measure research study What is the value of MD for…
Q: Question 6 1 pts A marketing firm conducted a study to assess consumer preferences of different…
A: Given :The leading beand in each categoru of $3, $6 and $10 priced cofee(for 12 oz of ground coffee)…
Q: Given the following: (xx). 20 0 0 0 20 0 0 0 20 0 0 0 20 (a) How many degree of freedom for…
A: Ans: none
Q: For the following scores, XY 0 4 2 9 1|6 19 a. Sketch a scatter plot and estimate the Pearson…
A: Given data set X Y X×Y X2 Y2 0 4 0 0 16 2 9 18 4 81 1 6 6 1 36 1 9 9 1 81…
Q: Which would be considered Quantitative data? O al List of temperatures for different cities in one…
A: Quantitative data are the result of counting or measuring attributes of a population, whereas…
Q: Here are the scatter plots for two sets of bivariate data with the same response variable. The first…
A: In the first graph, the data are scattered more compared to the second graph More the data…
Q: For the following data, state the null and alternative hypotheses. What is the chi-square and the…
A: Formulation of HypothesisNull Hypothesis H0: - The distribution is uniformAlternative Hypothesis H1:…
Q: What is the value of SP for the following set of data? X Y 3 3 1 2 2…
A: The Sum of Products is denoted as SP which describes the variability between two variables where one…
Q: Penicillin is produced by the Penicillin fungus, which is grown in a broth whose sugar content must…
A: The ANOVA is conducted by using EXCEL. The software procedure is given below: Enter the data.…
Q: Convert the following to z-score: a. Raw score of 100; mean of 60; SD of 15 b. Raw score of 95; mean…
A: Z=x-µσ This is the formula for z-score. x= raw score µ= mean σ= standard deviation (SD)
Q: The data below are from an independent-measures experiment comparing three different treatment…
A:
Q: An independent-measures study comparing two treatment conditions produces a t statistic with df =…
A: Provided information: Degrees of freedom = 18 Two samples are the same size.
Q: The following data gives the means of two samples taken from a population. Test whether there is any…
A: Given information: x=60y=59n1=100n2=200σ=50level of significance, α=0.05
Q: 10. For the following data, what are the dt values for repeated-measures for both dfb, dfw and df…
A: dfbetween=k-1=3-1=2 dfwithin=∑df=3-1+3-1+3-1=2×2×2=8
Q: f) Below are two charts, Figures 1f(i) and 1f(ii). Briefly explain your interpretation of each in…
A:
Q: In the stem-and-leaf display given below you can find the amount of solvent used in Kg (with leaves…
A: The probability is computed by using the formula,
Q: The following data were obtained from a repeated-measures research study. What is the value of MD…
A: Difference in the data is :5, 4, -2, 5
Q: What is the value of SP for the following set of data? 4 X 11 NN
A: SP means the sum of products.
Q: The data below are from an independent-measures experiment comparing three different treatment…
A:
Q: two most important variables are thought to be the pressure and the temperature. Three levels of…
A: hypothesis null hypothesis :the interaction between pressure and temperature is not significant…
Q: In the effect size formula, what does d stand for and what does m stand for? When considering a…
A: Effect size formula (Cohen’s D): One of the most common ways to measure effect size is Cohen’s D…
Q: The following data were obtained from a repeated-measures research study. What is the value of Mp…
A: x y d=x-y 10 15 -5 4 8 -4 7 6 1 6 11 -5 Total -13 Here n = 4
Q: The data below are from an independent-measures experiment comparing three different treatment…
A: The following information has been given: Treatment 1 Treatment 2 Treatment 3 0 1 4 0 4 3 0…
Q: Question 11 For the given data: 1; 9; 15; 22; 23; 24; 24; 25; 25; 26; 27; 28; 29; 37; 45; 50…
A: Number of terms, n = 16 Lower quartile, Q1 = [(n+1)/4] th item Q1 = (16+1)/4 = 17/4 = 4.25th term…
Q: Convert the following to z-score: c. Raw score of 86; mean of 55; SD of 17 d. Raw score of 115; mean…
A: we know that Z-score=X-μσwhere X=Raw scoreμ=meanσ=SD
Q: For which of the following situations would a repeated-measures research design be appropriate? a.…
A: Repeated measure design is a type of research experiment where we take same subject of same group of…
Q: The following data were obtained from a repeated-measures study. What is the value of SS for the…
A: From the provided information, Subject 1st 2nd 1 10 11 2 4 6 3 7 9…
Q: Question 3 For the following data set, calculate the Variance 4 10 12 36
A: We have to find the variance.
Q: Given the following data: The first quartile Q, =(-134) and Inter-quartile Range (IQR =110); Find…
A: We have to find third quartile..
Q: What is the value of SP for the following set of data? X Y 1 4 2 4 9 1 a. SP = -15 b. SP…
A:
Q: The following raw data were collected by a health an analyst from 50 smokers. It represents Risk…
A: Given that, the raw data were collected by a health analyst from 50 smokers. It represents Risk…
Q: Problem in photo
A: A study is said to be most precise, then it should have large sample size, minimum p-value, and…
Q: A set of n=4 pairs of X and Y value has SSx=6, SSy=18, and SP=9, for these data, what is the pearson…
A: Given information- No. of pairs, n = 4 Sum of square of x (SSx) = 6 Sum of square of y (SSy) = 18…
Q: Section 12.2 #12ab Section 12.5 NT #2 For the following, use the data from the previous problem…
A: Given:
Q: The following data are from a repeated-measures study comparing two treatment conditions. Complete…
A: Given, the repeated-measure study comparing two treatment conditions. No. of observation n=6 xi…
Q: Your sample has the following statistics: • Cov(x,y)=Sxy=35 • Correlation coefficient ľry =+0.5 •…
A: According to the given information, we have Covariance, Cov(x,y) = Sxy=35Correlation coefficient…
Q: The following data summarize the results from an independent-measures study comparing three…
A: (a). Determine whether there are any significant differences among the 3 treatment means There are 3…
Q: For the following data, what are the df values for the repeated-measures F-ratio? Treatments…
A:
Q: Find the 5 number summary for the data shown 2 7 11 18 24 33 45 50 52 55 66 82 85 93 100 5…
A:
Q: In the stem-and-leaf display given below you can find the amount of solvent used in Kg (with leaves…
A: First let us create a grouped frequency table with "9.0 but less than 10.0 Kg" as the first class.…
Q: mg/L3 red green blue 50 55 49 61 63 52 64 65 56 55 59 55 59 55 55 Using a one-way ANOVA, determine…
A: There are 3 independent samples which are red, green and blue. We have to test whether there is a…
Q: Penicillin is produced by the Penicillium fungus, which is grown in a broth whose sugar content must…
A: Since you have posted a question with multiple sub-parts, we will solve first three subparts for…
Q: For the following data, what are the df values to find the repeated-measures Fcritical? Treatments…
A: Here r = number of Subjects = 3 c = number of Treatments = 3
Q: A set of n=5 pairs of X and Y has SSx=16, SSy=4 and SP=2. for these data , what is the Pearson…
A:
Q: Does the overall association indicate agreement or disagreement between the mean subjective BRFSS…
A: * ANSWER :- From above information the answer is given below as ,
Q: For the following data: 18, 15, 12, 6, 8, 2, 3, 5, 20, 10. Find the value corresponding to the 25th…
A:
Q: QUESTION 11 An express delivery service company recently conducted a study to investigate the…
A: The problem can be solved using the concept of regression. as requested, i have attached handwritten…
Q: Given the following data set, let x be the explanatory variable and y be the response variable. x75…
A: The independent variable is x. The dependent variable is y. We have to find the coefficient of…
Q: The debate as to the limited role of medicine could be resolved if: Select one: O a. If we looked at…
A: d. if all causes of mortality were observed jointly


Trending now
This is a popular solution!

Step by step
Solved in 2 steps


- For the following studies, indicate which kinds of t-test, single sample, two independent samples, or repeated samples, has to be used. a. A researcher is comparing the amount of time spent playing video games each week for college males versus females. b. A researcher is comparing two new designs for cell phones by having a group of high school students send a text message on each model and measuring the difference in speed on each student. c. A researcher is evaluating the effects of fatigue by testing people in the morning when they are well rested and testing again at midnight when they have been awake for at least 14 hours. d. A researcher in nursing wanted to know if the recovery of patients was quicker when some received additional in-home care whereas others received the standard amount.Below is bivariate data on vintage dresser auctions, where X is the year of construction of the dresser and Y is the price sold at auction. Answer the following questions below using evidence.andres asked if there is a relationship between the quality of sneakers worn by a sample of 20 volleyball players and their average number of point scored per game. he computed r= +.21 and immediately claimed he had evidence that better-quality sneakers are related to better performance (a) is his claim correct? why? (b) what are Ho and Ha? (c) with alpha=.05, what is rcrit ?
- answer the blank please and the "These residuals do not all have the same sign because in the first two observations listed, the observed efficiency ratios were" ty!A dentist wanted to determine if a relationship existed between childhood fluoride exposure and cavities. She took a sample of adults in her practice and counted how many cavities each person had in his or her permanent teeth. She also determined how many years of childhood each person was exposed to tap water with fluoride. The minimum value on this variable was 0 and the maximum was 18. Using the data below, an alpha of .05 and a two-tailed test, was there a significant relationship? Years of fluoride Number of cavities 0 10 18 1 2 7 12 3 3 4 10 5 M = 7.5s =6.98 M = 5.00s = 3.16Compare the two separate scatterplots. In particular, how do the associtation compare between women with pets vs. women without pets? Does one group have more variation in systolic blood pressure than the other? If so, for which group? Does systolic blood pressure seem higher for common ages between the two groups? If so, for which group?
- The following SPSS output examines the percent of security staff that is female at private and public prisons. Based on the output answer the question below. Assuming the difference was significant, what is the effect size based on a calculated r2? A small difference between the prisons A moderate difference between the prisons A large difference between the prisonsFor each effect, state whether the null hypothesis was rejected or not. Calculate the effect size for the effect of stressFor a certain experiment, the following values of fracture stress (in megapascals) presented below were measured for a sample of 24 mixtures of hot-mixed asphalt (HMA). Determine the median, the lower quartile, the upper quartile, and the 65th percentile of the measurements.
- Given the data in the image, what would the correlation coefficients be with and without the outlier? Would the inclusion of the outlier change the evidence for or against a significant linear correlation?The average weight of a Coastal male Grizzly Bear is approximately normal with E(x); =795 pounds and SD * (x) = 80 pounds. 8. How likely is it to randomly select 64 Coastal male Grizzly Bears with a sample average weight of 810 pounds or more? Which density curve is the best model for this problem?Which of the following provides an estimate of the effect the variables of interest have on one another regardless of sample size? a) power b) alpha c) effect size d) p value