For the following pairs of data points (10, 100), (8, 120), (5, 200), (4, 200), (10, 90), (7, 110), and (6, 15O), the value of bq is O A. -81.2147 O B. 18.2174 O C. 18.2174 O D. -18.2174
For the following pairs of data points (10, 100), (8, 120), (5, 200), (4, 200), (10, 90), (7, 110), and (6, 15O), the value of bq is O A. -81.2147 O B. 18.2174 O C. 18.2174 O D. -18.2174

Glencoe Algebra 1, Student Edition, 9780079039897, 0079039898, 2018
18th Edition
ISBN:9780079039897
Author:Carter
Publisher:Carter
Chapter4: Equations Of Linear Functions
Section: Chapter Questions
Problem 8SGR

Related questions
Question
Transcribed Image Text:estion
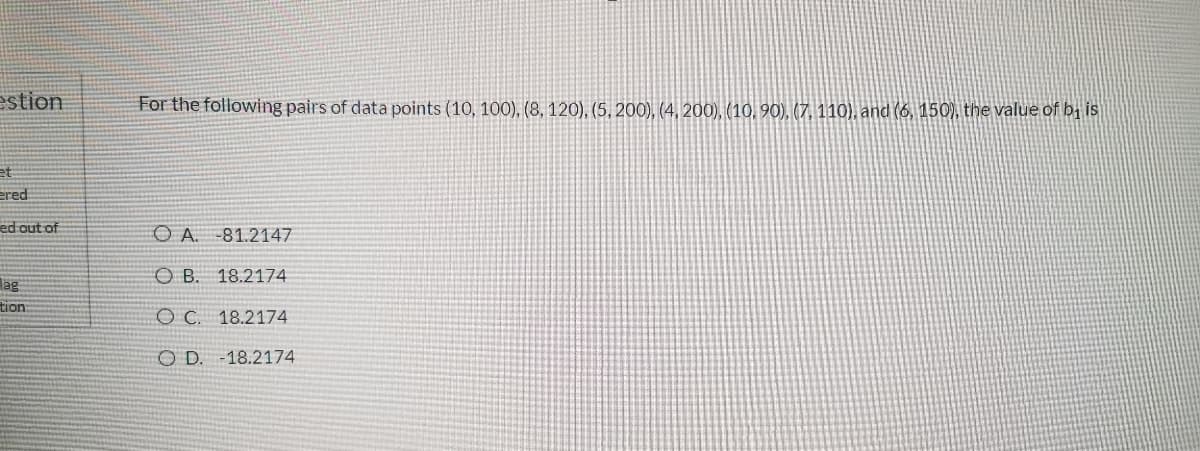
For the following pairs of data points (10, 100), (8, 120), (5, 200), (4, 200), (10, 90), (7, 110), and (6, 150), the value of bị is
et
ered
ed out of
OA.
-81.2147
O B. 18.2174
lag
tion:
O C. 18.2174
O D. -18.2174
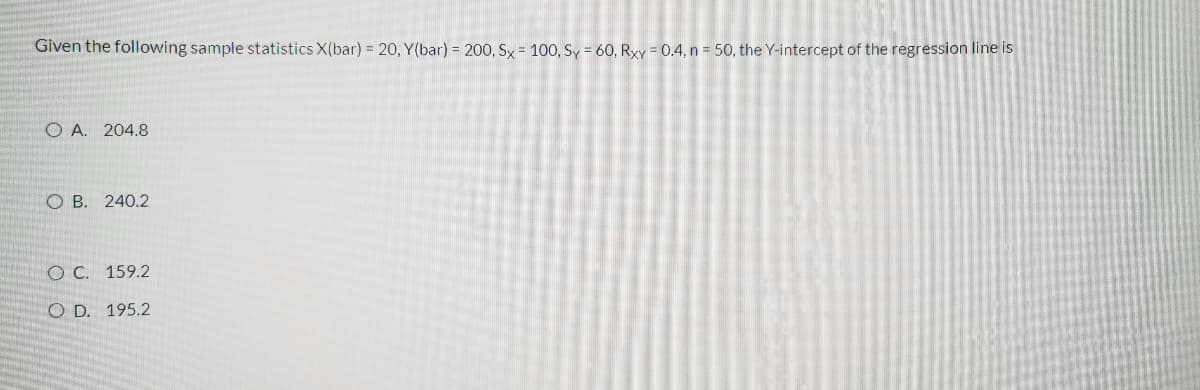
Transcribed Image Text:Given the following sample statistics X(bar) = 20, Y(bar) = 200, Sx = 100, Sy = 60, Rxy = 0.4, n = 50, the Y-intercept of the regression line is
O A. 204.8
O B. 240.2
O C. 159.2
O D. 195.2
Expert Solution
This question has been solved!
Explore an expertly crafted, step-by-step solution for a thorough understanding of key concepts.

Step by step
Solved in 3 steps

Recommended textbooks for you
Glencoe Algebra 1, Student Edition, 9780079039897…
Algebra
ISBN:
9780079039897
Author:
Carter
Publisher:
McGraw Hill
Glencoe Algebra 1, Student Edition, 9780079039897…
Algebra
ISBN:
9780079039897
Author:
Carter
Publisher:
McGraw Hill