For this analysis, the “exercise” variable was divided into 4 approximately equally-sized groups: (1) low exercise, (2) below average exercise, (3) above average exercise, and (4) high exercise. Is there sufficient evidence to suggest that these 4 groups significantly differ in average BMI scores (using an alpha level of .05)? Examine the results in the above tables and provide a brief write-up of your interpretation of these results
For this analysis, the “exercise” variable was divided into 4 approximately equally-sized groups: (1) low exercise, (2) below average exercise, (3) above average exercise, and (4) high exercise. Is there sufficient evidence to suggest that these 4 groups significantly differ in average BMI scores (using an alpha level of .05)? Examine the results in the above tables and provide a brief write-up of your interpretation of these results

MATLAB: An Introduction with Applications
6th Edition
ISBN:9781119256830
Author:Amos Gilat
Publisher:Amos Gilat
Chapter1: Starting With Matlab
Section: Chapter Questions
Problem 1P

Related questions
Topic Video
Question
Statistics:
For this analysis, the “exercise” variable was divided into 4 approximately equally-sized groups: (1) low exercise, (2) below average exercise, (3) above average exercise, and (4) high exercise. Is there sufficient evidence to suggest that these 4 groups significantly differ in average BMI scores (using an alpha level of .05)? Examine the results in the above tables and provide a brief write-up of your interpretation of these results
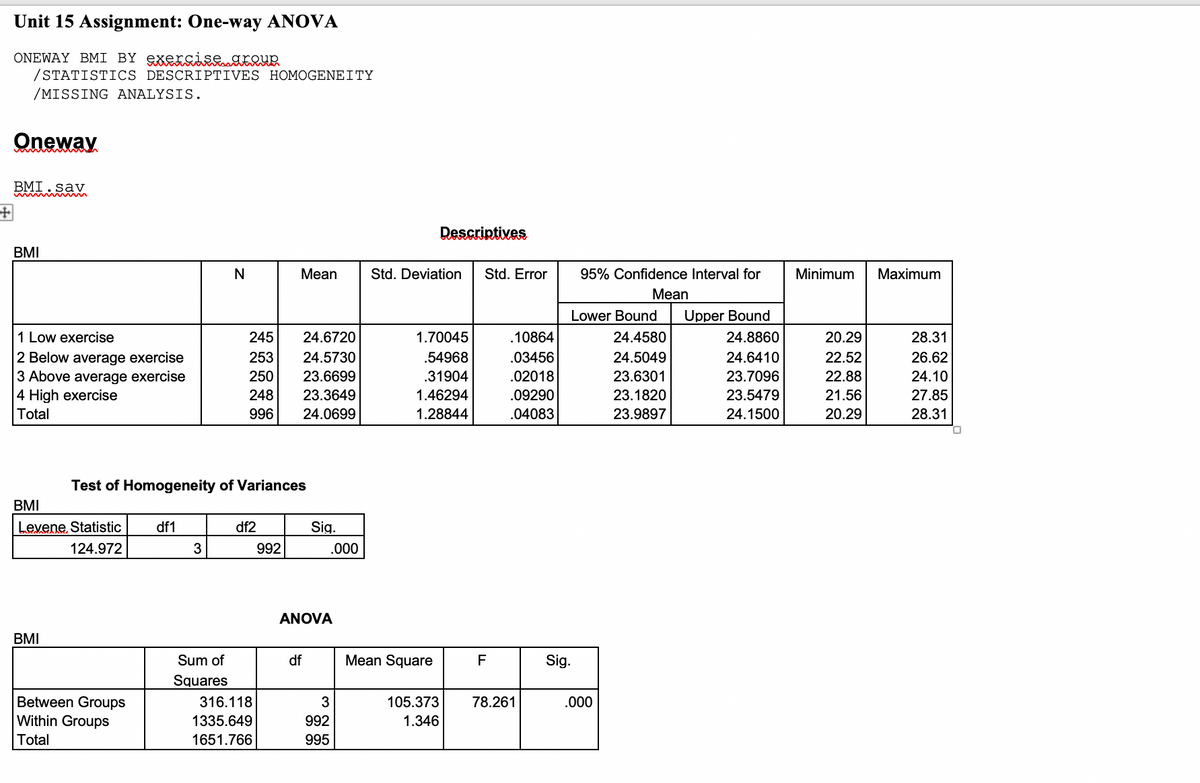
Transcribed Image Text:Unit 15 Assignment: One-way ANOVA
ONEWAY BMI BY exercise groUR
/STATISTICS DESCRIPTIVES HOMOGENEITY
/MISSING ANALYSIS.
Oneway
BMI.sav
Descrintives
BMI
N
Мean
Std. Deviation
Std. Error
95% Confidence Interval for
Minimum
Maximum
Mean
Lower Bound
Upper Bound
1 Low exercise
245
24.6720
1.70045
.10864
24.4580
24.8860
20.29
28.31
2 Below average exercise
3 Above average exercise
4 High exercise
253
24.5730
.54968
.03456
24.5049
24.6410
22.52
26.62
250
23.6699
.31904
.02018
23.6301
23.7096
22.88
24.10
248
23.3649
1.46294
.09290
23.1820
23.5479
21.56
27.85
Total
996
24.0699
1.28844
.04083
23.9897
24.1500
20.29
28.31
Test of Homogeneity of Variances
BMI
Levene, Statistic
df1
df2
Sig.
124.972
992
.000
ANOVA
BMI
Sum of
df
Mean Square
F
Sig.
Squares
Between Groups
Within Groups
316.118
105.373
78.261
.000
1335.649
992
1.346
Total
1651.766
995
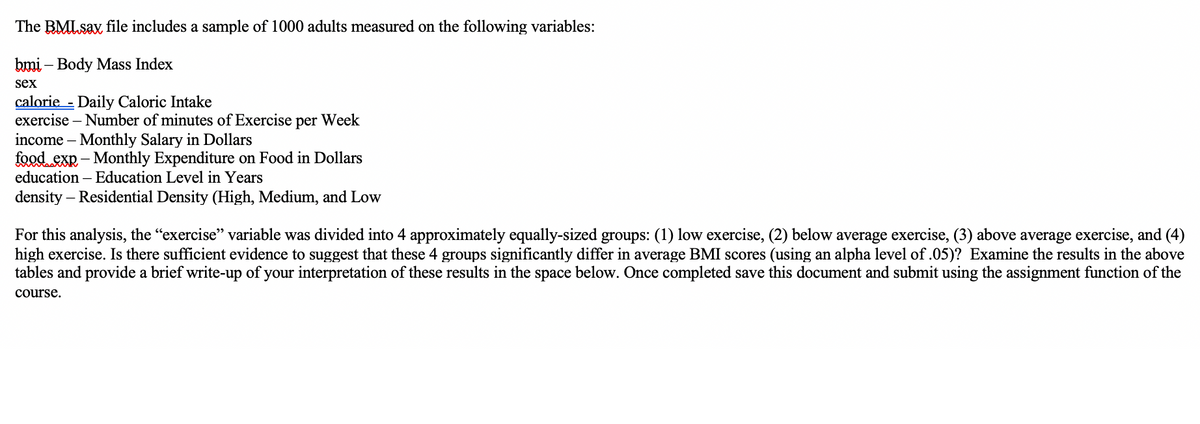
Transcribed Image Text:The BMLsax file includes a sample of 1000 adults measured on the following variables:
bmi – Body Mass Index
sex
calorie - Daily Caloric Intake
exercise – Number of minutes of Exercise per Week
income – Monthly Salary in Dollars
foed exR - Monthly Expenditure on Food in Dollars
education – Education Level in Years
density – Residential Density (High, Medium, and Low
-
For this analysis, the "exercise" variable was divided into 4 approximately equally-sized groups: (1) low exercise, (2) below average exercise, (3) above average exercise, and (4)
high exercise. Is there sufficient evidence to suggest that these 4 groups significantly differ in average BMI scores (using an alpha level of .05)? Examine the results in the above
tables and provide a brief write-up of your interpretation of these results in the space below. Once completed save this document and submit using the assignment function of the
course.
Expert Solution
This question has been solved!
Explore an expertly crafted, step-by-step solution for a thorough understanding of key concepts.

This is a popular solution!

Trending now
This is a popular solution!

Step by step
Solved in 2 steps

Knowledge Booster


Learn more about
Need a deep-dive on the concept behind this application? Look no further. Learn more about this topic, statistics and related others by exploring similar questions and additional content below.Recommended textbooks for you
MATLAB: An Introduction with Applications
Statistics
ISBN:
9781119256830
Author:
Amos Gilat
Publisher:
John Wiley & Sons Inc

Probability and Statistics for Engineering and th…
Statistics
ISBN:
9781305251809
Author:
Jay L. Devore
Publisher:
Cengage Learning

Statistics for The Behavioral Sciences (MindTap C…
Statistics
ISBN:
9781305504912
Author:
Frederick J Gravetter, Larry B. Wallnau
Publisher:
Cengage Learning
MATLAB: An Introduction with Applications
Statistics
ISBN:
9781119256830
Author:
Amos Gilat
Publisher:
John Wiley & Sons Inc
Probability and Statistics for Engineering and th…
Statistics
ISBN:
9781305251809
Author:
Jay L. Devore
Publisher:
Cengage Learning
Statistics for The Behavioral Sciences (MindTap C…
Statistics
ISBN:
9781305504912
Author:
Frederick J Gravetter, Larry B. Wallnau
Publisher:
Cengage Learning

Elementary Statistics: Picturing the World (7th E…
Statistics
ISBN:
9780134683416
Author:
Ron Larson, Betsy Farber
Publisher:
PEARSON

The Basic Practice of Statistics
Statistics
ISBN:
9781319042578
Author:
David S. Moore, William I. Notz, Michael A. Fligner
Publisher:
W. H. Freeman

Introduction to the Practice of Statistics
Statistics
ISBN:
9781319013387
Author:
David S. Moore, George P. McCabe, Bruce A. Craig
Publisher:
W. H. Freeman