Forest Fires and Acres Burned An environmentalist wants to determine the relationships between the numbers ( thousands ) of forest fires over the year and the number ( in hundred thousands ) of acres burned . The data for 6 recent years are shown . Number of fires (x) 62 57 45 72 69 58 Number of acres burned (y) 15 30 15 62 42 19
Forest Fires and Acres Burned An environmentalist wants to determine the relationships between the numbers ( thousands ) of forest fires over the year and the number ( in hundred thousands ) of acres burned . The data for 6 recent years are shown . Number of fires (x) 62 57 45 72 69 58 Number of acres burned (y) 15 30 15 62 42 19

Glencoe Algebra 1, Student Edition, 9780079039897, 0079039898, 2018
18th Edition
ISBN:9780079039897
Author:Carter
Publisher:Carter
Chapter4: Equations Of Linear Functions
Section4.5: Correlation And Causation
Problem 2AGP

Related questions
Question
Forest Fires and Acres Burned An environmentalist wants to determine the relationships between the numbers ( thousands ) of forest fires over the year and the number ( in hundred thousands ) of acres burned . The data for 6 recent years are shown .
| Number of fires (x) | 62 | 57 | 45 | 72 | 69 | 58 |
| Number of acres burned (y) | 15 | 30 | 15 | 62 | 42 | 19 |
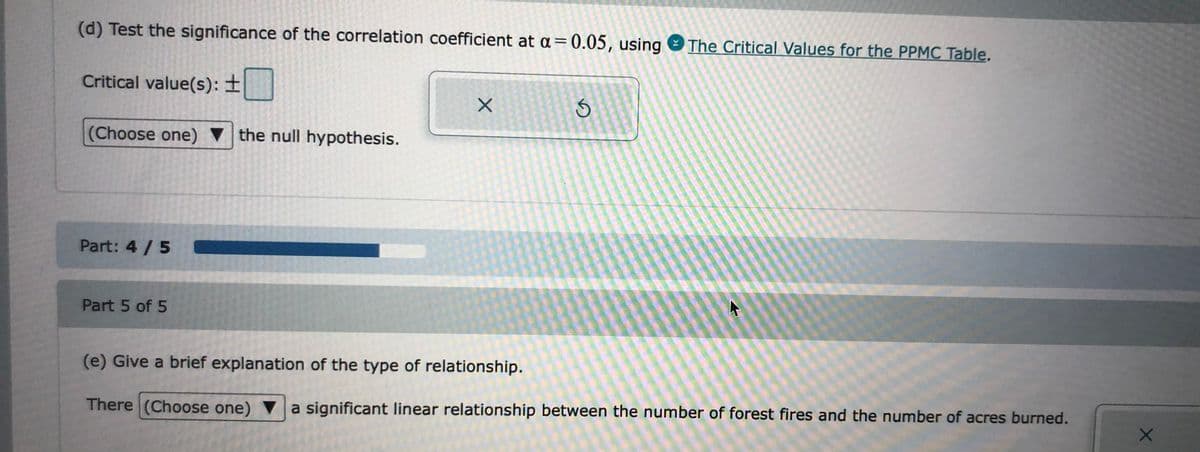
Transcribed Image Text:(d) Test the significance of the correlation coefficient at a =0.05, using
The Critical Values for the PPMC Table.
Critical value(s): ±
(Choose one) v the null hypothesis.
Part: 4 /5
Part 5 of 5
(e) Give a brief explanation of the type of relationship.
There (Choose one) ▼a significant linear relationship between the number of forest fires and the number of acres burned.
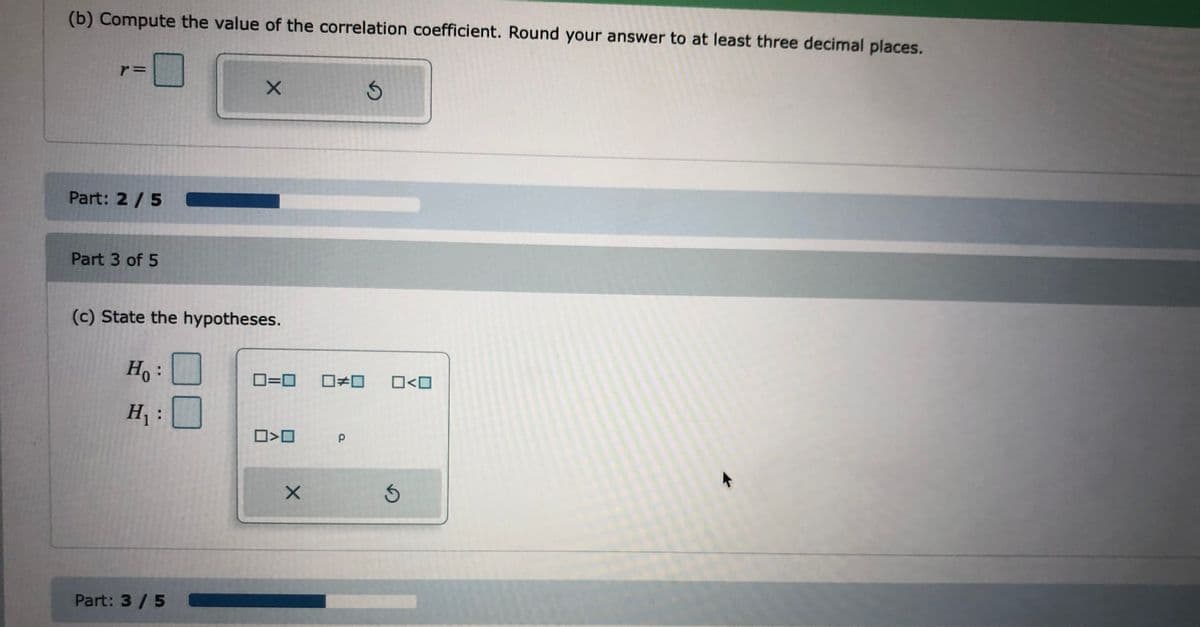
Transcribed Image Text:(b) Compute the value of the correlation coefficient. Round your answer to at least three decimal places.
r=
Part: 2/5
Part 3 of 5
(c) State the hypotheses.
Ho :
ロ=ロ ロチロ
O<O
H:
ロ>ロ
Part: 3/5
の
Expert Solution
This question has been solved!
Explore an expertly crafted, step-by-step solution for a thorough understanding of key concepts.

This is a popular solution!

Trending now
This is a popular solution!

Step by step
Solved in 5 steps with 2 images

Recommended textbooks for you
Glencoe Algebra 1, Student Edition, 9780079039897…
Algebra
ISBN:
9780079039897
Author:
Carter
Publisher:
McGraw Hill
Glencoe Algebra 1, Student Edition, 9780079039897…
Algebra
ISBN:
9780079039897
Author:
Carter
Publisher:
McGraw Hill