Four histograms are displayed below. These histograms are labelled Histogram A, Histogram B, Histogram C and Histogram D, respectively. 150- 100- 50- 0- 50- 40- 30- 20- 10- 0- 75- 50- 25- 0 30- 20- 10- 0- Values Frequency „ 100 Histogram A Histogram B Histogram C Histogram D
Four histograms are displayed below. These histograms are labelled Histogram A, Histogram B, Histogram C and Histogram D, respectively. 150- 100- 50- 0- 50- 40- 30- 20- 10- 0- 75- 50- 25- 0 30- 20- 10- 0- Values Frequency „ 100 Histogram A Histogram B Histogram C Histogram D

College Algebra (MindTap Course List)
12th Edition
ISBN:9781305652231
Author:R. David Gustafson, Jeff Hughes
Publisher:R. David Gustafson, Jeff Hughes
Chapter8: Sequences, Series, And Probability
Section8.6: Permutations And Combinations
Problem 2SC: How many different signals can be sent, when three flags are used, if two of the 9 flags are...

Related questions
Question
q18A-
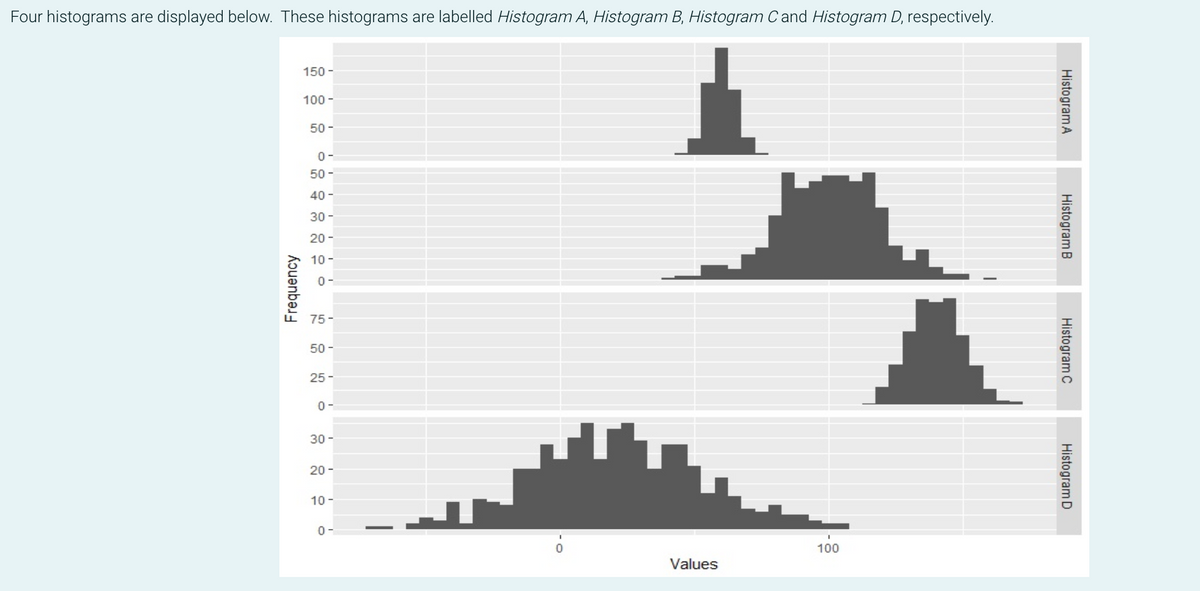
Transcribed Image Text:Four histograms are displayed below. These histograms are labelled Histogram A, Histogram B, Histogram C and Histogram D, respectively.
150-
1
100-
50-
0-
50-
40-
--
30-
20-
10
100
Frequency
0-
75-
50-
25-
0-
30-
20-
10-
0-
T
Values
Histogram A
Histogram B.
Histogram C
Histogram D
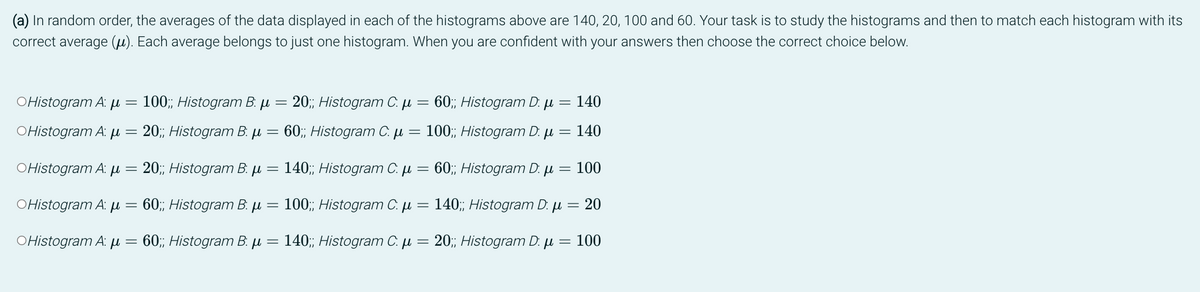
Transcribed Image Text:(a) In random order, the averages of the data displayed in each of the histograms above are 140, 20, 100 and 60. Your task is to study the histograms and then to match each histogram with its
correct average (μ). Each average belongs to just one histogram. When you are confident with your answers then choose the correct choice below.
OHistogram A: μ
=
100;; Histogram B: μ = 20;; Histogram C. μ =
140
60;; Histogram D: μ =
μl 140
OHistogram A. μ
20;; Histogram B. μ
60;; Histogram C. μ
=
100;; Histogram D:
=
OHistogram A: μ
20;; Histogram B: μ =
140;; Histogram C. μ =
60;; Histogram D: μ = 100
OHistogram A: μ
60;; Histogram B: μ
100;; Histogram C. μ = 140;; Histogram D: μ = 20
OHistogram A: μ
60;; Histogram B: μ
=
140;; Histogram C. μ = 20;; Histogram D: μ = 100
=
=
=
Expert Solution
This question has been solved!
Explore an expertly crafted, step-by-step solution for a thorough understanding of key concepts.

This is a popular solution!

Trending now
This is a popular solution!

Step by step
Solved in 2 steps

Recommended textbooks for you
College Algebra (MindTap Course List)
Algebra
ISBN:
9781305652231
Author:
R. David Gustafson, Jeff Hughes
Publisher:
Cengage Learning

Glencoe Algebra 1, Student Edition, 9780079039897…
Algebra
ISBN:
9780079039897
Author:
Carter
Publisher:
McGraw Hill
College Algebra (MindTap Course List)
Algebra
ISBN:
9781305652231
Author:
R. David Gustafson, Jeff Hughes
Publisher:
Cengage Learning
Glencoe Algebra 1, Student Edition, 9780079039897…
Algebra
ISBN:
9780079039897
Author:
Carter
Publisher:
McGraw Hill