From 2013 – 2016, what was the total spending in each of the four calendar years? In each of the years 2013 - 2016, how much was spent in each of the three categories of government (Education, General Government, and Public Works)? In 2016, which account (use the field “Account Desc” for this answer) was the largest in the General Government category? In 2016, who was Somerville’s largest vendor as measured by total dollars spent? How many separate payments did the city make to this vendor? What was the average amount of each payment to this vendor? Why did the city pay this vendor? How much in expenditures did Somerville have related to Property, Plant and Equipment (use the field “Item Class” for this answer) in the General Government category in each of the years 2013 – 2016? How much in expenditures in each of those years were related to repairs and maintenance?
From 2013 – 2016, what was the total spending in each of the four calendar years? In each of the years 2013 - 2016, how much was spent in each of the three categories of government (Education, General Government, and Public Works)? In 2016, which account (use the field “Account Desc” for this answer) was the largest in the General Government category? In 2016, who was Somerville’s largest vendor as measured by total dollars spent? How many separate payments did the city make to this vendor? What was the average amount of each payment to this vendor? Why did the city pay this vendor? How much in expenditures did Somerville have related to Property, Plant and Equipment (use the field “Item Class” for this answer) in the General Government category in each of the years 2013 – 2016? How much in expenditures in each of those years were related to repairs and maintenance?

Chapter1: Financial Statements And Business Decisions
Section: Chapter Questions
Problem 1Q

Related questions

Question
- From 2013 – 2016, what was the total spending in each of the four calendar years? In each of the years 2013 - 2016, how much was spent in each of the three categories of government (Education, General Government, and Public Works)?
- In 2016, which account (use the field “Account Desc” for this answer) was the largest in the General Government category?
- In 2016, who was Somerville’s largest vendor as measured by total dollars spent? How many separate payments did the city make to this vendor? What was the average amount of each payment to this vendor? Why did the city pay this vendor?
- How much in expenditures did Somerville have related to Property, Plant and Equipment (use the field “Item Class” for this answer) in the General Government category in each of the years 2013 – 2016? How much in expenditures in each of those years were related to repairs and maintenance?
- Prepare a pivot table that shows a line chart of Somerville’s expenditures in each of the three categories of government (Education, General Government, and Public Works) for the years 2013 – 2016. Prepare a pivot chart using the line chart type of this information on the same worksheet. Analyze the pivot chart and summarize the trends.
- As a separate document, create a memo about what you found in the pivot tables and charts. Assume that the readers of the memo will be both city officials who are knowledgeable about the city but not about data analytics or necessarily how to interpret data. You should make this a standalone document. That is, the person should not need to go back and forth between your memo and your analysis. You are free to copy any information you wish from your analysis to make this possible.
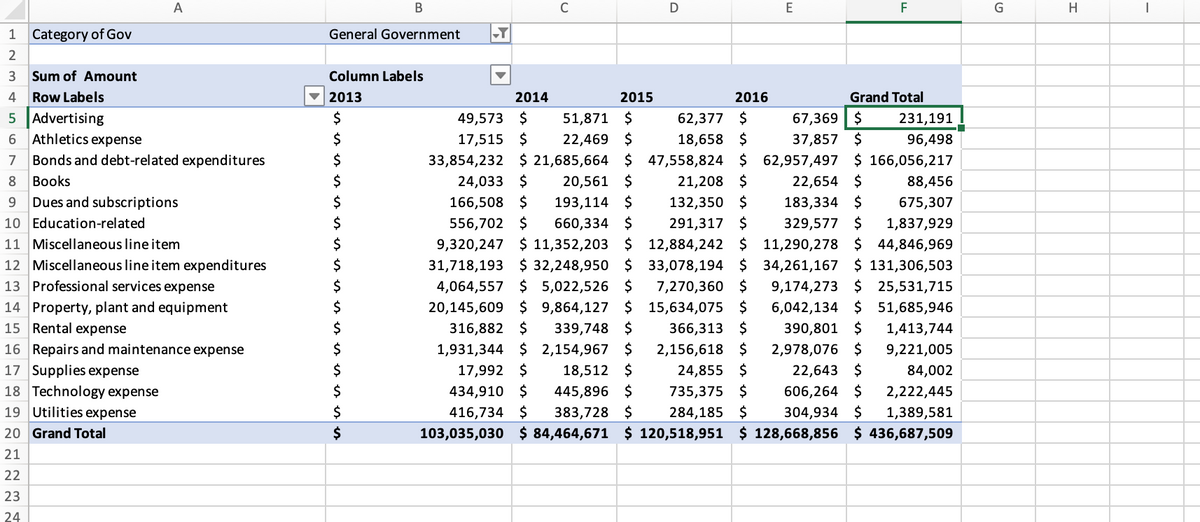
Transcribed Image Text:A
C
E
F
G
H
1
Category of Gov
General Government
3
Sum of Amount
Column Labels
4
Row Labels
2013
2014
2015
2016
Grand Total
5 Advertising
6 Athletics expense
$
49,573 $
17,515 $
33,854,232 $ 21,685,664 $ 47,558,824 $
51,871 $
62,377 $
67,369| $
231,191
22,469 $
18,658 $
37,857 $
96,498
7
Bonds and debt-related expenditures
62,957,497 $ 166,056,217
8.
Вooks
24,033 $
20,561 $
21,208 $
22,654 $
88,456
Dues and subscriptions
$
166,508 $
193,114 $
132,350 $
183,334 $
675,307
291,317 $
9,320,247 $ 11,352,203 $ 12,884,242 $ 11,290,278 $ 44,846,969
31,718,193 $ 32,248,950 $ 33,078,194 $ 34,261,167 $ 131,306,503
7,270,360 $
10 Education-related
$
556,702 $
660,334 $
329,577 $
1,837,929
11 Miscellaneous line item
12 Miscellaneous line item expenditures
$
13 Professional services expense
4,064,557 $ 5,022,526 $
20,145,609 $ 9,864,127 $ 15,634,075 $
9,174,273 $ 25,531,715
6,042,134 $ 51,685,946
390,801 $
2,978,076 $
22,643 $
606,264 $
$
14 Property, plant and equipment
15 Rental expense
316,882 $
1,931,344 $ 2,154,967 $
339,748 $
366,313 $
1,413,744
2,156,618 $
24,855 $
735,375 $
$
16 Repairs and maintenance expense
17 Supplies expense
9,221,005
17,992
18,512 $
84,002
18 Technology expense
434,910 $
445,896 $
2,222,445
19 Utilities expense
416,734 $
383,728 $
284,185 $
304,934 $
1,389,581
20 Grand Total
$
103,035,030 $ 84,464,671 $ 120,518,951 $ 128,668,856 $ 436,687,509
21
22
23
24
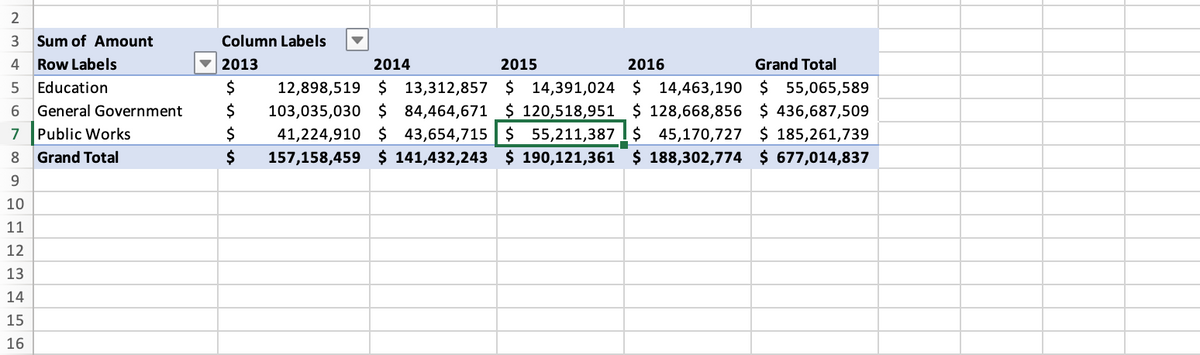
Transcribed Image Text:2
3
Sum of Amount
Column Labels
4
Row Labels
2013
2014
2015
2016
Grand Total
5 Education
$
12,898,519 $ 13,312,857 $ 14,391,024 $ 14,463,190 $ 55,065,589
6 General Government
$
103,035,030 $ 84,464,671 $ 120,518,951 $ 128,668,856 $ 436,687,509
7 Public Works
2$
41,224,910 $ 43,654,715 $ 55,211,387I$ 45,170,727 $ 185,261,739
8
Grand Total
$
157,158,459 $ 141,432,243 $ 190,121,361 $ 188,302,774 $ 677,014,837
10
11
12
13
14
15
16
Expert Solution
This question has been solved!
Explore an expertly crafted, step-by-step solution for a thorough understanding of key concepts.

This is a popular solution!

Trending now
This is a popular solution!

Step by step
Solved in 2 steps

Knowledge Booster


Learn more about
Need a deep-dive on the concept behind this application? Look no further. Learn more about this topic, accounting and related others by exploring similar questions and additional content below.Recommended textbooks for you

Accounting
Accounting
ISBN:
9781337272094
Author:
WARREN, Carl S., Reeve, James M., Duchac, Jonathan E.
Publisher:
Cengage Learning,

Accounting Information Systems
Accounting
ISBN:
9781337619202
Author:
Hall, James A.
Publisher:
Cengage Learning,
Accounting
Accounting
ISBN:
9781337272094
Author:
WARREN, Carl S., Reeve, James M., Duchac, Jonathan E.
Publisher:
Cengage Learning,
Accounting Information Systems
Accounting
ISBN:
9781337619202
Author:
Hall, James A.
Publisher:
Cengage Learning,

Horngren's Cost Accounting: A Managerial Emphasis…
Accounting
ISBN:
9780134475585
Author:
Srikant M. Datar, Madhav V. Rajan
Publisher:
PEARSON

Intermediate Accounting
Accounting
ISBN:
9781259722660
Author:
J. David Spiceland, Mark W. Nelson, Wayne M Thomas
Publisher:
McGraw-Hill Education

Financial and Managerial Accounting
Accounting
ISBN:
9781259726705
Author:
John J Wild, Ken W. Shaw, Barbara Chiappetta Fundamental Accounting Principles
Publisher:
McGraw-Hill Education