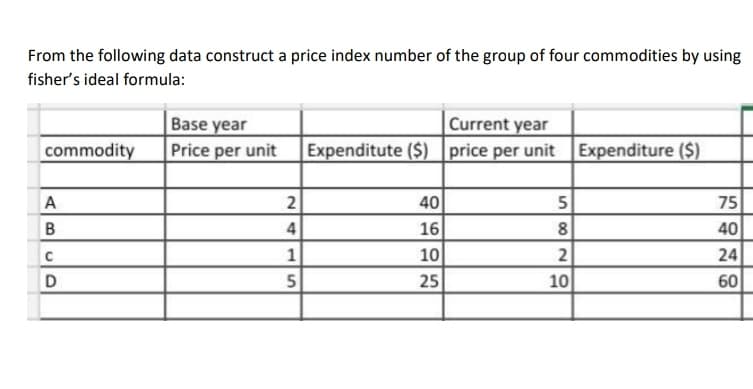
From the following data construct a price index number of the group of four commodities by using fisher's ideal formula: Base year Price per unit Current year Expenditute ($) price per unit Expenditure ($) commodity 40 75 16 8 40 10 2 24 D 25 10 60 15


Q: if you make guesses on 4 multiple choice test questions each with 5 possible answers, what is the pr...
A: Given: Number of questions, n=4 There are 5 possible answers for each question
Q: Statistics: In a regression linear equation for one predictor and a dependent variable, in which of ...
A: Given that In a regression linear equation for one predictor and a dependent variable, in which of ...
Q: Based on the given info in the picture, determine the ff: • range score • average/mean score • lowes...
A: From given stem and leaf the data set is45,46,48,53,54,55,56,59,62,63,65,66,66,69,69,70,71,71,73,73,...
Q: In finance, one example of a derivative is a financial asset whose value is determined (derived) fro...
A: Disclaimer : “Since you have posted a question with multiple sub-parts, we will solve first three su...
Q: Example 7-34. Find the probability generating function of : (a) P (X Sn), (b) P (X <n), and (c) P (X...
A:
Q: The lengths of adult males' hands are normally distributed with mean 189 mm and standard deviation i...
A:
Q: Draw the mean and range charts from the following data and state your conclusion. Sample No. 1 3 4 5...
A:
Q: The equation y = -0.0017x + 52.1926 represents the relationship between the temperature and the alti...
A:
Q: lillustrations 5. (b) The mean of 200 items was 50. Later on it was discovered that two items were M...
A:
Q: Standard normal area P(1.25 0.54) а. b. С.
A:
Q: Illustration 3. Find out the value of quartile deviation and its coefficient from the following data...
A: Given data is Roll No. 1 2 3 4 5 6 7 Marks 20 28 40 12 30 15 50
Q: Win Loss Total Regular defense 41 9 50 Prevent defense 32 18 50 Total 73 27 100 Compare the probabil...
A: Given that, coach reviews the outcomes of 100 games. We need to compare the probability of winning ...
Q: Is it possible to interpret the y-intercept? Explain. (Choose one) ▼ the x-values are all (Choose on...
A: The objective is to find if is possible to intercept the y-intercept.
Q: 5. A sample size 30 has a mean of 150, population mean of 140, and a standard deviation of 13. Find...
A: Given,sample mean(x¯)=150sample size(n)=30standard deviation(s)=13population mean(μ)=140
Q: - In a classroom with two students, find the mean of the number of students who will be boys. The pr...
A: Given that n=2 , p=1/2=0.5 , q=1-p=1-0.5=0.5 X~Binomial(n=2 , p=0.5) p=Probability of boy X=Number ...
Q: Assume that different groups of couples use a particular method of gender selection and each couple ...
A: Given Information: Sample size n=48 Probability of a girl i.e., probability of success p=0.5 Probab...
Q: Attempt the following: (i) P(A) = 0.75, P(B) = 0.50 and P(A U B) = 0.87, are the events A and B inde...
A: Given,P(A)=0.75 , P(B)=0.50 AND P(A∪B)=0.87
Q: B. Determine whether the pair of measures of angles are complementary or supplementary. 1. 25° and 6...
A: Given We want determine which pair of measures of angles are complementary or supplementary. 1) 25∘ ...
Q: In an experiment on pea-breeding Mendel obtained the following frequencies of seed : 315 round and y...
A:
Q: 9. A set of data is normally distributed with a mean of 40 and a standard deviation of which interva...
A: Given that Mean=μ=40 Standard deviation=σ
Q: 8. Which of the following does not represent an example of a discrete probability distribution? c. 6...
A: Given We want choose appropriate option for given statement.
Q: In a random experiment, two fair dice are tossed and the sum of the two dice (i.e., the sum of the n...
A: Probability : Probability is defined as a event which is going to happened. it always lies between 0...
Q: The scale of the correlation coefficient is: a. nominal
A: Qualitative variables: The variables which having the distinct categories are known as qualitative ...
Q: The following table lists the calories per 100 milliliters of 25 popular beers. Construct a box-and-...
A: Arrange the given data in ascending order26, 32 , 36, 36 , 37 , 39, 39, 40, 40, 41, 42, 42,43, 45, 4...
Q: An endocrinologist is interested in the effects of depression on the thyroid. It is believed that he...
A: Given:
Q: The subject has more freedom to respond to a/an ________. questionnaire survey interview experim...
A: A questionnaire is a series of questions used to collect information from respondents. Data are coll...
Q: In the context of national level sports competitions, in a province there are four athletes who will...
A: Given Information: Consider the data that shows the results of the four players A, B, C, and D. N...
Q: the average length of time for students to register for classes at a certain college has been 110 mi...
A: Given,sample size(n)=20sample mean(x¯)=90standard deviation(s)=14.5degrees of freedom(df)=n-1df=20-1...
Q: A box contains 5 balls. Two are numbered 3, one is numbered 4, and two are numbered 5. The balls are...
A:
Q: One thousand tickets are sold at $3 each. One ticket will be randomly selected and the winner will ...
A:
Q: Example 8-26. If a fair coin is tossed an even number 2n times, show that the probabiling 2n Fobtain...
A:
Q: Statistics Variable N N* Mean SE Mean StDev Minimum Q1 Median Q3 Maximum n=1 1000 0 1...
A: Given information: μ=100, σ=100, n=144
Q: Which of the following illustrate(s) inferential statistics? You may pick only one, both, or none
A:
Q: - Calculate mean deviation from the following series: 10 11 12 13 14 Y 3 12 18 12 3
A:
Q: Why would you use the Tukey-Kramer procedure? a. To test for normality. b. To test for homogeneit...
A: Why would you use the Tukey-Kramer procedure? a. To test for normality. b. To test for homogeneit...
Q: Give a brief analysis on the graph given in the picture by using the data (Dominant behaviors of rei...
A: From the given graph, The dominant behaviors are given for treatment 1 and treatment 2. From the giv...
Q: Determine which of the four leuels (nominal, ordinal, interval, catio is most áppropriate: of measur...
A: Let levels of measurement be LoM. 4 LoM are nominal, ordinal, interval and ratio.
Q: In a bumper test, three types of autos were deliberately crashed into a barrier at 5 mph, and the re...
A: We need to test whether the mean crash damages of the three vehicles are same or not. So, the hypot...
Q: Refer to the following scenario. A government official is in charge of allocating social programs th...
A:
Q: 1. Which of the following is an example of continuous random variable? a. capacity of an auditorium ...
A: Given the three statements , we need to choose correct option from given multiple choices.
Q: Let X denote the reaction time, in seconds, to a certain stimulus and Y denote the temperature (•F) ...
A: Here X: Reaction time in second Y: Temperature Given joint pdf of x and y is f(x,y)= 4xy , ...
Q: Alustration 10. Obtain the value of median from the following data: 753, 522, . 777, 91, 384, 591, 6...
A:
Q: A continuous random variable X that can assume values between x = 0 and x = 4 has a density function...
A:
Q: In a certain inspection site, it is known that, on the average, 1 in every 50 persons exceeded 37 C ...
A: Since the probability of the first person with an exceeding temperature of 37C (i.e., the first succ...
Q: Example: The daily lottery costs $1 to play. You pick a 3-digit number. If you win, you win $500. Fi...
A: Hello! As you have posted 2 different questions, we are answering the first question. In case you re...
Q: State the null and the alternative hypothesis. Determine the level of significance.
A: Claim that there is a significant difference among the means of the groups according to the years in...
Q: Consider the regression mode, y = a + Bx + ɛ; where, E (ɛ | x) = 0, E(ɛx) = 0, Var (ɛ|x)= oʻ, and Va...
A: From the given information, y=α+βx+ε Eε|x=0Eεx=0Varε|x=σ2Varα+βx|x=0 a) Vary|x=Varα+βx+ε|x ...
Q: Compute the least-squares regression equation for the given data set. Round the slope and y-intercep...
A: We have given that, X:- 4, 7, 3, 1, 5 Y:- 3, 5, 6, 7, 2 Then, We will find the least- square regre...
Q: Write the equation of the least-squares regression line. Use the full accuracy shown in the calculat...
A: Given Output is y=a+bx a=1.79563452 b=0.37294231 r2=0.4114455045 We want the equation of the least-s...
Q: 2. The frequency of heavy rains in one week follows a Poisson distribution with parameter A. Accordi...
A: a) The Poisson pmf given λ is given by, P(X=x)=e-λλxx!, x=0,1,2,...... where λ>0. The joint pmf f...

Step by step
Solved in 2 steps with 2 images

- Suppose one canoe rents for 40,and2 is taken off the price for each additional canoe rented by a ground. What size group gives the most income? Assume that there are 20 canoes available.Construct index number of price from the following data byapplying: Marshall-Edgeworth’s methodand comment on the results. Commodity Price Quantty Price QuanttyA 2 8 4 6B 5 10 6 5C 4 14 5 10D 2 19 2 13The following table is a selection of average prices for a gallon of gas in the United States. Year Gas Price Index Value 2000 $1.48 [A] 2001 $1.42 [B] 2004 $1.85 [C] 2007 $2.80 [D] Build an index from these values, using 2001 as the base year. Round each index value to the nearest tenth. [A] = [B] = [C] = [D] =
- Construct index number of price from the following data byapplying: 1)Paasche’s method Commodity Price Quantty Price QuanttyA 2 8 4 6B 5 10 6 5C 4 14 5 10D 2 19 2 13In a particularly small region in the Philippines, the consumer price index C depends onThe following table indicates the unit prices (in Rands) and quantities of three goods held in the national warehouse of a DIY (“do it yourself”) store for the years 2020 and 2021. ITEM 2020 unit price 2020 quantity 2021 unit price 2021 quantity MINERAL SPIRITS R 17.70 30 R20.70 45 10mm spanner R37 60 R49 50 25mm brush R 42 30 R48 40 Again, using 2020 as the base year, compute the Paasche price index for all of the items for 2021. Interpret your answer.
- The following table provides information on the number of claims (in 1 000s), as well as the average value of claims (in R 1000) for the year 2003 and 2006 at a certain medical aid. Type of claim 2003 2006 Number of claims Average claim Number of claims Average claims G.practitioners 22 42 32 56 Medicine 55 120 78 158 Dental 16 190 26 180 Specialist 36 220 28 260 Hospitalisation 18 360 20 420 Find the Paasche quantity indices for 2006 with 2003 as the base period for the claims of the medical aid company.The following table gives the prices of some food items in the base year and current year and the quantities sold in the base year and current year. Commodity 2000 2005 Price (K) Quantity Price (K) Quantity A 15 15 22 12 B 20 5 27 4 C 4 10 7 5 Compute the following price index numbers for 2005 from the above table: Laspeyre’s price index number Paasche’s price index numberBelow are percentages for annual sales growth and net sales attributed to loyalty card usage at 74 Noodles & Company restaurants. Annual Sales Growth (px;) and Loyalty Card Usage (px; of Net Sales)(n = 74 restaurants) Store Growth% Loyalty% Store Growth% Loyalty% 1 -7.8 0.7 38 7.3 1.5 2 -6.9 2.5 39 7.4 1.7 3 -5.1 1.6 40 7.7 2.3 4 -4.7 1.4 41 8.0 2.0 5 -3.8 2.5 42 8.0 1.6 6 -1.7 1.5 43 8.3 1.9 7 -1.7 2.6 44 8.4 2.0 8 -1.6 2.4 45 8.6 2.2 9 -1.1 2.2 46 8.6 1.6 10 -1.0 1.9 47 8.7 0.9 11 0.4 1.2 48 8.9 1.7 12 0.6 0.5 49 9.4 1.6 13 0.6 2.1 50 9.5 1.3 14 1.0 1.3 51 9.5 2.1 15 1.3 2.0 52 10.5…
- Suppose the table gives the number N(t), measured in thousands, of minimally invasive cosmetic surgery procedures performed in the United States for various years t. t N(t) (thousands) 2000 5,490 2002 4,897 2004 7,455 2006 9,138 2008 10,882 2010 11,561 2012 13,075 Construct a table of estimated values for N'(t). (Use a one-sided difference quotient with an adjacent point for the first and last values, and the average of two difference quotients with adjacent points for all other values. Round your answers to two decimal places.)Which EWMA chart below will yield ARL performance most close to that of cusum chart with k=1/2 and h=5? a. L=2.814, lamda=0.10 b. L=2.615, lamda=0.05 c. L=2.998, lamda=0.25 d. L=3.054, lamda=0.40 e. L=2.962, lamda=0.20The following table shows the weekly total sales (in dollars) at a small roadside fruit stand for the months of April through July. Month Weekly Sales April 839 1271 1109 1075 May 868 1233 986 966 June 1168 1037 1130 1185 July 888 1017 913 1178 Can you conclude that the weekly sales varies with the month? Use the 2% level of significance.