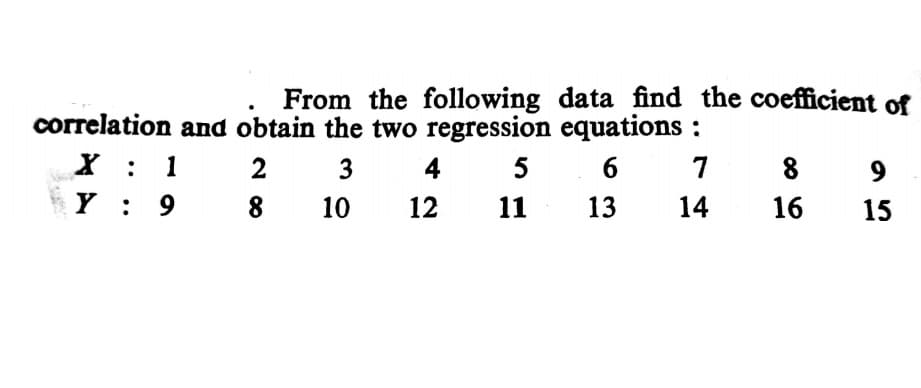
From the following data find the coefficient of correlation and obtain the two regression equations : X : 1 2 3 4 5 6. 7 8 9 Y : 8 10 12 11 13 14 16 15


Q: Table 7.6 Price per Unitin 2015 Units Purchased 2014 2016 Good A $100 $2.00 $1.50 242.50 $150 Good B...
A: Given that The price per unit for different goods in different years. Base year = 2015 We know th...
Q: Let X be a binomial random variable that is binomially distributed with a mean 9 and a variance of 6...
A:
Q: Permutation combination drawing names from a box containing 10 names choosing household chores to do...
A: “Since you have posted a question with multiple sub-parts, we will solve first three subparts for yo...
Q: A car hire firm has two cars, which it hires out day by day. The number.of demands for a car on each...
A:
Q: that the numbers on them make up a certain four-digit number. Find the likelihood that when installi...
A: Here given , There are total four disks And on each of the disk there are 5 sector Each sector cont...
Q: Hypothesis testing procedures rely on using the information from the population of interest True ...
A: We have given that, Hypothesis testing procedures rely on using the information from the population ...
Q: 84 92 87 77 98 58 63 97 82 94 84 68 64 92 78 75 84 06 The following data give the score of 18 studen...
A: We have given that data I want to find percentile and quartile. P83 =(83(n+1)/100)th Q3=(3(n+1)/4)...
Q: To standardize a normal random variable that has mean u and variance o we use the formula z True O F...
A:
Q: NOTE Notation Beta(a, B) EXTE Find EGG valx) Parameters a > 0 shape (real) B > 0 shape (real) x E [0...
A: Given that X follows Beta distribution having parameters α and β We have to find E(X) and Var(X)
Q: 3. Favorite Sport Fifty: people were asked to identify their favorite sport. The responses were F = ...
A: The frequency is the count or number of times an observation occurred in the observation. The indivi...
Q: Let X be a binomial random variable with a mean of 0.5 and a variance of 0.45. Find P(x is greater t...
A:
Q: 8. Suppose that Y is normally distributed with parameters u and o. You observe Y and then build a re...
A: Given that Y is normally distributed with parameters μ and σ.
Q: 15. In the "secret" lock on the common axis are four disks, each of which is divided into five secto...
A: Given that In a secret lock on the common axis are 4 disk Each of which is divided into 5 sectors ...
Q: com Tollowing faw data probabilities and the central limit theorem probabilities? Raw Data Probabili...
A: Probabilities from raw data is somewhat off the chart but little bit around the corner. The actual p...
Q: i. What is the value of the degree of freedom for this test? ii. What is the p-value for this test?...
A: The claim is that workers are for or against mandatory vaccination.
Q: Question: IQ scores are measured from 30 children who participated in Head Start and from 32 otherwi...
A:
Q: if we further assume the AR(1) series being a Gaussian process, please give the general formula for ...
A: Given: AR(1) series is a gaussian process
Q: B. Complete the frequecy distribution table and find the measures of dispersion Class Interval Frequ...
A:
Q: Example 10. From the following data, estimate the number of persons earning weekly wages between 60 ...
A:
Q: recent year, a sample of the South American Redeye Piranha was collected by fishermen on a particula...
A: We have given that Sample size n =60 Sample mean =12.88 99%confidence interval. (12.09,13.67)
Q: Making use of the data summarized below, calculate the coefficient of correlation, 12 : Case X1 X2 C...
A:
Q: (a) Find the equation of the regression line that gives the length as a function of time. (Let t be ...
A: Here use regression formula
Q: "The weights of 1,000 children, in average, is 62kg with standard deviation of 16kg. Suppose the wei...
A:
Q: Illustration 12.25 Trend equation for yearly sales (in '000 Rs) for a commodity with year 1979 as or...
A:
Q: Suppose f (x) = 8x, 0 < x < 0.5 is a pdf. P(X=0.3)=? O 2.4/0.5 О 0.36 O 2.4
A: Result If f(x) is the continuous distribution then P(X=c)=0
Q: In how many ways can an adviser assign a different task to 9 students from a class of 15?
A: Here we need to assign a different task then we would use combination. Combination formula: C(n,r)...
Q: The life, in years, of a certain type of electrical switch has an exponential distribution with a me...
A:
Q: The hospitalization period, in days, for patients following treatment for a serious kidney disorder ...
A:
Q: Construct the confidence interval for the population mean u. c=0.95, x = 15.7, o = 7.0, and n= 75 A ...
A: Given problem Given that c = 0.95 x̄ = 15.7 σ = 7.0 n = 75
Q: From the values of the factors given below, find the corrected values of the first four Moments abou...
A:
Q: i) If U, and U, each have a normal distribution with mean 0 and variance 202. Furthermore, my, (t) =...
A:
Q: Diastolic blood pressure is a measure of the pressure when arteries rest between heartbeats. Suppose...
A:
Q: Calculate Karl Pearson's coefficient of skewness : Variable Frequency Variable Frequency 70-80 11 30...
A:
Q: An 1868 paper by German physician Carl Wunderlich reported, based on over a million body temperature...
A:
Q: b. Let X be a continuous random variable with probability density function for 0 <x < 1 for 1 <x< 3 ...
A: Givenf(x)=a for 0≤x≤1b for 1≤x≤30 otherwise
Q: 18. The following data pertaining to the number of members in a family. Find median of the family.
A: It is known that Median = middle value of sorted data = (n + 1)/2 th observation To find (n + 1)/2 t...
Q: 1llustration 12.13. (i) Given the trend equation Y=35+5X+3X2 w re 1968 =0 a nd X unit=1 year. Change...
A:
Q: The graph illustrates the distribution of test scores taken by College Algebra students. The maximum...
A:
Q: 11 18 24 33 47 59 61 72 (1) Find Quartile 2 (2) Percentile 50
A: Given data, 11,18,24,33,47,59,61,72 Sort the data in ascending order 11,18,24,33,47,59,61,72
Q: For each of the following, identify the exam score that should lead to the better grade. A score of ...
A: Consider that the mean and standard deviation of a random variable x are µ and σ, respectively. Thus...
Q: . If Z is a standard normal random variable find the following probabilities (Use Standard Normal Ta...
A: Solution: Let Z be the standard normal variable with mean 0 and standard deviation 1. Z~N(0, 1)
Q: An electrical firm manufactures light bulbs that have a length of life that is normally distributed ...
A:
Q: (b) Determine the value for x such that P(-x < X < x) = 0.90.
A: Solution-: Given: a=-1, b=1 We find x such that, P(-x<X<x)=0.90
Q: Assume that there is a 9% rate of disk drive failure in a year. a. If all your computer data is stor...
A: The following solution is given below:
Q: Finding p and ĝ In Exercises 3–12, let p be the population proportion for the given condition. Find ...
A: As per our guidelines we are supposed to answer only 3 sub-parts of any question so I am solving fir...
Q: The seedlings of a particular type of tree are randomly dispersed in a large area, with an average o...
A: Poison distribution used only, If a problem contains the average value for happening of an event per...
Q: 9. Fungicides are used to protect seeds in wet environments. To test the effectiveness of a fungicid...
A: From the provided information, Twenty seeds were planted wherein ten seeds were treated with fungici...
Q: Suppose X~N (μ,σ') then X – H - - N (0, 1) o2 O True O False
A:
Q: The average retirement age in the United States among currently living retirees is 60 years old. Ass...
A: Given that mean =60 ,s.d =2 Find what proportion of retirees were of the following ages? More than ...
Q: Transcriptional bursting is a fundamental property of genes in which transcription from DNA to mRNA ...
A:

Step by step
Solved in 3 steps with 3 images

- For the following exercises, consider the data in Table 5, which shows the percent of unemployed in a city ofpeople25 years or older who are college graduates is given below, by year. 41. Based on the set of data given in Table 7, calculatethe regression line using a calculator or othertechnology tool, and determine the correlationcoefficient to three decimal places.Find the equation of the regression line for the following data set. x 1 2 3 y 0 3 4For the following exercises, use Table 4 which shows the percent of unemployed persons 25 years or older who are college graduates in a particular city, by year. Based on the set of data given in Table 5, calculate the regression line using a calculator or other technology tool, and determine the correlation coefficient. Round to three decimal places of accuracy
- For the following exercises, consider the data in Table 5, which shows the percent of unemployed ina city of people 25 years or older who are college graduates is given below, by year. 40. Based on the set of data given in Table 6, calculate the regression line using a calculator or other technology tool, and determine the correlation coefficient to three decimal places.Use the following table to find the equation of the regression line, between x and y x312304y210342The following estimated regression model was developed relating yearly income (y in $1000s) of 30 individuals with their age (x1) and their gender (x2) (0 if male and 1 if female).ŷ = 30 + 0.7x1 + 3x2Also provided are SST = 1200 and SSE = 384.The multiple coefficient of determination is _____.
- The following estimated regression model was developed relating yearly income (y in $1000s) of 30 individuals with their age (x1) and their gender (x2) (0 if male and 1 if female).ŷ = 30 + 0.7x1 + 3x2Also provided are SST = 1200 and SSE = 384.The yearly income of a 24-year-old female individual is _____.Consider a linear regression model for the decrease in blood pressure (mmHg) over a four-week period with muy=2.8+0.8x and standard deviation chi=3.2. The explanatory variable x is the number of servings fruits and vegetables in a calorie-controlled diet. Using the 68-95-99.7 rule, between what two values would approximately 95% of the observed responses, y, fall when x = 7?A regression between foot length (y) ( in cm) and height (x) ( in inches) for 33 students resulted in the following regression equation: y^=10.9+0.23x One student in the sample was 73 inches tall with a foot length of 29 cm. What is the residual for this student?
- For the simple regression equation (a), conduct an individual significance tests at the 5% significance level to determine if SQFT is a significant predictor of Price. (Check photo for data)For the following scores X Y 3 8 5 8 2 6 2 3 4 6 1 4 4 7 Compute the standard error of estimate for this regression equation and show steps please!BASED ON THIS DATA, what does the r^2 values tell you? and the linear regression line is the information statistically significant?
