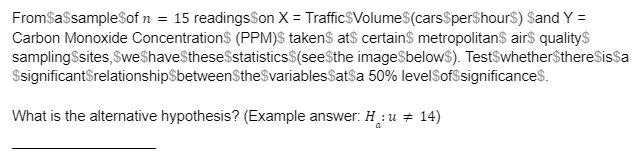
FromSa$sampleSof n = 15 readingsSon X = Traffic$Volume$(carsSperShour$) Sand Y = Carbon Monoxide Concentrations (PPM)$ takens ats certains metropolitans air$ qualitys sampling$sites,SweShaveSthesestatistics$(seeSthe image$below$). Test$whether$thereSissa $significantSrelationship$betweenSthe$variablesSatsa 50% levelSof$significances. What is the alternative hypothesis? (Example answer: H: u # 14)


Q: J.D. Power and Associates surveys new automobile owners to learn about the quality of recently…
A: As per our guidelines, we are allowed to answer first three sub-parts only. Thanks A categorical…
Q: A study regarding the relationship between age and the amount of pressure sales personnel feel in…
A: a. Decision rule: If P-value is less than or equal to the significance level, reject the null…
Q: Below are four bivariate data sets and the scatter plot for each. (Note that each scatter plot is…
A: Given - The data are given in 4 different points In Excel To Find in a scatter diagram different…
Q: Consider the following examples of populations, together with the variable/characteristic measured…
A: Given: Population: All undergraduate students enrolled at SLU for the 1st SemesterVariable:…
Q: 2. Mr. Canaria has a private resort. He decided to record the temperature in one week and the number…
A: Claim: there is a significant relationship between the two.
Q: A real estate developer wishes to study the relationship between the size of home a client will…
A:
Q: HOME Realty claims that it can sell a detached, residential house faster than any other realty…
A: Given Selling time (in days) vs relative frequency
Q: a) What kind of relationship exist between the exam scores and the clas sizes? Interpret the…
A: The regression line is given by score = 95 -1.2Size There is a negative relationship between the…
Q: A real estate developer wishes to study the relationship between the size of home a client will…
A: Hint: Performed in Excel and explaining with screenshot.
Q: Using an alpha level of 0.05, are domestic calls more dangerous for officers than other types of…
A:
Q: A real estate developer wishes to study the relationship between the size of home a client will…
A: Note:- Since you have posted a question with multiple sub-parts, we will solve first three sub-parts…
Q: In ongoing economic analyses, the federal government compares per capita incomes not only among…
A:
Q: Below are four bivariate data sets and their scatter plots. (Note that all of the scatter plots are…
A: The relationship between two variables can be observed using a scatter plot. Scatter plot simply…
Q: A pet association claims that the mean annual costs of food for dogs and cats are the same. The…
A: From the provided information,
Q: Run the ANOVA at 0.05 level of significance based on the provided data. Copy the Excel output below.…
A:
Q: Case scenario: Karrie studied the effects of coffee drinking and subsequent development of…
A: Given Information: Variables of interest=02Variables under study=1. Effect of Coffee drinking.2.…
Q: 3. It was known that a toxic material was dumped in a river leading into a large salt water…
A: Introduction: One way ANOVA: The t-test is used to compare the equality of two population means.…
Q: a. Develop an appropriate multiple regression equation using stepwise regression. (Use Excel data…
A: As per our guidelines, we are allowed to answer first three sub-parts only. Thanks As per the…
Q: Below are four bivariate data sets and their scatter plots. Each data set is made up of sample…
A: Correlation coefficient : The Correlation coefficient is used to measures strength of the…
Q: Consider following artificial population Y X Compute variance of mean per unit, ratio and regression…
A: Sampling with replacement: Consider a population of potato sacks, each of which has either 12, 13,…
Q: Breast feeding sometimes results in a temporary loss of bone mass as calcium is depleted in the…
A: P B d 2128 1926 202 2885 2549 336 2895 2825 70 1944 1922 22 1750 1626 124…
Q: 15. A study is conducted to compare mean cholesterol conventional (low-fat, low-calorie) diet for at…
A: Hi! Thank you for posting the question. Since you have posted multiple questions, we are answering…
Q: Which of the following is NOT one of IBM's big data characteristics? Variety Velocity Venn diagram…
A: Big data is the data set, which have huge volume that is beyond to perform manual analysis. Such…
Q: A college professor is interested in finding out if there is a relationship between the post-test…
A: Given that Let X denotes the students score on Algebra and Y denotes on Calculus Significance…
Q: Consider the following examples of populations, together with the variable/characteristic measured…
A: Statistics: Statistics is a branch of science that deals with collection, organizing, analysis of…
Q: A study regarding the relationship between age and the amount of pressure sales personnel feel in…
A: From the given data number of rows=4 number of columns=3
Q: Source Treatment SS 2.385 MS = SS/df 0.795 Fill in the missing entries in the partially completed…
A: The given table is one-way ANOVA table. We have to find the missing values.
Q: Judge and Cable (2010) reported the results of a study demonstrating a negative relationship between…
A: Solution: From the given information,
Q: Consider the following examples of populations, together with the variable/characteristic measured…
A: Population: Accountability reports by State Universities and Colleges and Government Owned and…
Q: a.Two instruments are used to measure enzyme activity by colorimetry. You want to know if the…
A: Given: A B 0.86 0.87 0.82 0.74 0.75 0.63 0.61 0.55 0.89 0.76 0.64 0.7 0.81 0.69…
Q: surface streams Research reported the results of a study on the occurrence oxygen and central…
A: The question is about regression Given :
Q: Consider the following examples of populations, together with the variable/characteristic measured…
A: Given: Population: All items manufactured for the month of July in a certain manufacturing company.…
Q: A researcher wanted to determine if carpeted rooms contain more bacteria than uncarpeted rooms. The…
A: Given information: A researcher wants to determine whether or not the carpeted rooms contain more…
Q: web Search…
A: Solution
Q: Toblem 3. Two water treatment reservoirs were examined to determine if there was a difference in…
A: Given :
Q: A college professor is interested in finding out if there is a relationship between the post-test…
A:
Q: The Rip-off Vending Machine Company operates coffee vending machines in office buildings. The No. of…
A: We have given that Sample size n = 9 Level of significance =?=0.05
Q: (20) The Journal of Hazardous Materials published the results of a study on the chemical properties…
A: From the given information, we have n1=9 n2=8n3=15 x1=0.94x2=1.01x3=0.33 s1=0.17s2=0.40s3=0.21
Q: An internet service provider (ISP) has experienced rapid growth in the past five years. As part of…
A: a. Consider that µ is the population mean for daily usage times for the ISP's customers.
Q: Problem in photo
A: A study is said to be most precise, then it should have large sample size, minimum p-value, and…
Q: Suppose we have a data set and we found the line of best fit for the scatter plot. If the scatter…
A: Here we have to choose the correct conclusion of the residuals vs x-variable.
Q: An experiment was conducted to investigate the effects of the concentrations of sulfuric acid…
A:
Q: The quantitative relationship between X and Y in a typical data set or a sample is OA. always zero,…
A: The effect of X on Y in a typical data set or a sample is not clear, because this effect may be due…
Q: The following data represent the results from an independent-measures study comparing three…
A: anova table SS df MS F p-value F-critical Between: 16.00 2 8.00 2.80 0.0836 3.47…
Q: A study was designed to compare the attitudes of two groups of nursing students toward computers.…
A: Since you have posted a question with multiple sub-parts, we will solve first three subparts for…
Q: #2...Can you write out answer please n thank u
A: Let r denote the linear correlation between income (x) and ACT composite score (y). The hypotheses…
Q: Identify the missing value for SSW in the ANOVA summary table. Source SS df MS F Between…
A: Given ANOVA table:The ANOVA table is given below.
Q: The president of a school club would like to purchase T-shirts for members of the club and asks…
A: Categorical variable: Categorical variables are those variables which characterize the data using…
Q: Students from Sandalwood High School were asked, when given the choice between math or English,…
A: The given data is : 55 males preferred math 52 males preferred english 42 females preferred maths 51…
Q: Consider the following examples of populations, together with the variable/characteristic measured…
A: Given : Population : All items manufactured for the month of July in a certain manufacturing…
[fourth question]

Step by step
Solved in 2 steps with 2 images

- Urban Travel Times Population of cities and driving times are related, as shown in the accompanying table, which shows the 1960 population N, in thousands, for several cities, together with the average time T, in minutes, sent by residents driving to work. City Population N Driving time T Los Angeles 6489 16.8 Pittsburgh 1804 12.6 Washington 1808 14.3 Hutchinson 38 6.1 Nashville 347 10.8 Tallahassee 48 7.3 An analysis of these data, along with data from 17 other cities in the United States and Canada, led to a power model of average driving time as a function of population. a Construct a power model of driving time in minutes as a function of population measured in thousands b Is average driving time in Pittsburgh more or less than would be expected from its population? c If you wish to move to a smaller city to reduce your average driving time to work by 25, how much smaller should the city be?A sample of 20 students who had recently taken elementary statistics yielded the following information on brand of calculator owned. (T = Texas Instruments, H = Hewlett Packard, C = Casio, S = Sharp): C T S S T C S H C T H H H H T T T T H T (a) Estimate the true proportion of all such students who own a Texas Instruments calculator.(b) Of the 8 students who owned a TI calculator, 6 had graphing calculators. Estimate the proportion of students who do not own a TI graphing calculator.Life-saving drug: Penicillin is produced by the Penicillin fungus, which is grown in a broth whose sugar content must be carefully controlled. Several samples of broth were taken on three successive days, and the amount of dissolved sugars, in milligrams per milliliter, was measured on each sample. The results were as follows. Day 1: 5.2 5.0 5.4 5.2 5.3 5.0 4.9 5.0 5.2 5.0 4.6 5.3 Day 2: 5.6 4.8 4.9 5.3 5.2 4.9 5.4 5.0 5.4 4.9 5.5 5.4 Day 3: 5.9 4.9 5.3 5.4 5.2 5.5 5.0 5.8 5.5 5.4 5.4 5.1 Construct an ANOVA table. Round your answers to four decimal places as needed. One-way ANOVA: Sugar Concentration Source DF SS MS F P Days Error Total
- Background: The Worcester heart attack data provided below contains the systolic blood pressures of patients hospitalized for acute myocardial infarction (heart attack). This data is a protion of a larger data set compiled by Dr. Robert J. Goldberg of the Department of Cardiology at the University of Massachusetts Medical School between 1975 and 2001. The Center for Disease Control and Prevention (CDC) recommends that people maintain a systolic blood pressure of less than 140 mmHg. Systolic 154 120 147 126 134 80 194 150 211 169 157 194 149 152 138 140 125 166 197 139 123 210 166 115 144 170 118 167 113 168 108 128 148 129 140 185 151 132 149 171 199 183 93 82 182 211 121 171 187 158 113 117 123 135 119 152 194 144 111 129 161 117 122 123 111 130 149 136 126 81 230 99 162 96 139 122 191 150 120 149 154 103 111 113…A marketing study had as its purpose the examination and comparison of response rates bydifferent sized business to postal surveys. 200 large and 200 small companies were investigated. Acompany was deemed to have responded if the survey was returned within 6 weeks of beingposted out. The data are shown in the Table.Small Large TotalResponse 125 96 221No Response 75 104 179Total 200 200 400Chi-Sq = 8.504; DF = 1; P-Value = 0.004Table. Results of Survey ExperimentState the null and alternative hypotheses associated with the chi-squared test. Interpretthe result in this case.Engro group, who recently sold its Engro foods start-up for a multi-million-rupees sum, islooking for another investment for fresh capital. It is considering an investment in coal (X) andsolar (Y) power plant. For that they had a collected data on 5 different characteristics. Amandahas applied k-means clustering to this data for k = 2. Given the following data:Table 5.1 Observations X Y 1 20 18 2 8 20 3 36 26 4 22 12 5 14 4 a) Which value of k is the most appropriate to categorize these investments? Justify yourchoice with calculations.b) The two cluster centers after the first round of execution. c) The final two clusters. d) Visually represent the clusters of both parts (b) and (c).
- With the growth of internet service providers, a researcher decides to examine whether there is a relationship between cost of internet service per month (rounded to the nearest dollar) and degree of customer satisfaction (on a scale of 1 - 10 with a 1 being not at all satisfied and a 10 being extremely satisfied). The researcher only includes programs with comparable types of services. A sample of the data is provided below: dollars satisfaction 11 6 18 8 17 10 15 4 9 9 5 6 12 3 19 5 22 2 25 10 a. Determine what is the appropriate statistical procedure. b. Explicitly state the null hypothesis. c. Execute the proper calculations with the appropriate formula(s). d. Please state your conclusion based on the results you obtain. Present your results using APA format if appropriate. e. Briefly state why you used this particular statistical procedure. - Assume p = .05 unless otherwise indicated.The activities required to service a car at the Exclusive Car Mart is summarised in the following table: Table 1: Activity Times and Predecessors Minutes Required Activity Description Predecessor Activity Optimistic a Most Likely m Pessimistic b A B C D E F G H Drain Oil Replace Filter Refill Oil Check Tyres Wash Windows Fill Fluids Service A/c Final Test --- A B, E --- D E C C, F 3 2 3 3 4 4 3 1.5 4.5 3 4.5 4 3 4 3 2 7 5 6 6 7 6 5 3.5 The variability in times required to perform each activity is due to the different types, sizes, and conditions of the cars to be serviced. Required Draw the activity network for this problem (either AON or AOA) Determine the Expected Time and Variance for each activity. Round to 2 decimal places where applicable. Show the activity schedule (ES, EF, LS, and LF) as well as slack. Determine and state the critical path for this project. This must be based on your work in c) and not by inspection.…Toward the middle of the harvesting season, peaches for canning come in three types, early, late, and extra late, depending on the expected date of ripening. During a certain week, the data to the right were recorded at a fruit delivery station. Complete parts (a) through (d) below. 40 trucks went out carrying early peaches; 71 carried late peaches; 52 carried extra late peaches; 26 carried early and late; 32 carried late and extra late; 11 carried early and extra late; 6 carried all three; 5 carried only figs (no peaches at all). a) How many trucks carried only late variety peaches? trucks (Type a whole number.) (b) How many carried only extra late? trucks (Type a whole number.) (c) How many carried only one type of peach? trucks (Type a whole number.) (d)How many trucks (in all) went out during the week? trucks (Type a whole number.)