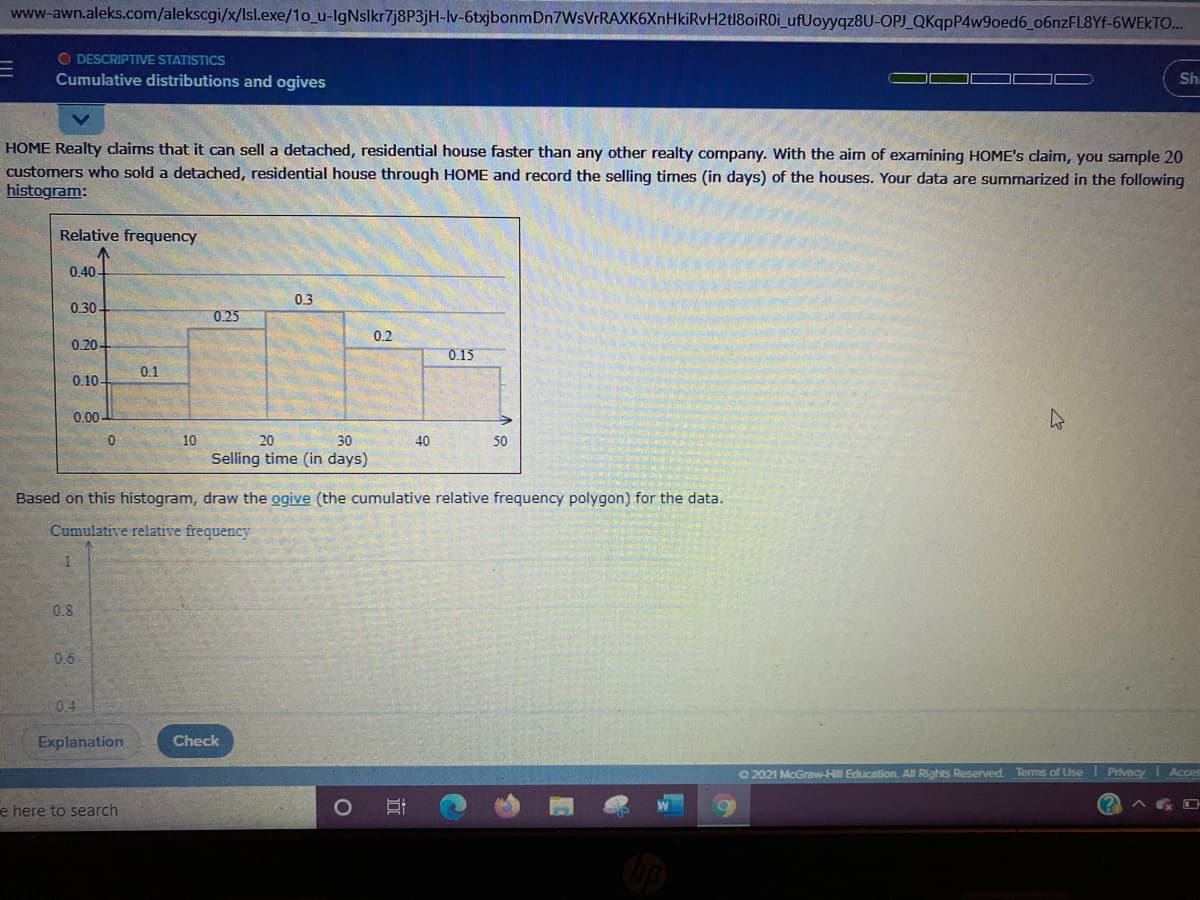
HOME Realty claims that it can sell a detached, residential house faster than any other realty company. With the aim of examining HOME's claim, you sample 20 customers who sold a detached, residential house through HOME and record the selling times (in days) of the houses. Your data are summarized in the following nistogram: Relative frequency 0.40- 0.3 0.30- 0.25 0.2 0.20- 0.15 0.1 0.10- 0.00 10 20 30 40 50 Selling time (in days) histogram (the cumulative relative frequer polygon) for the data


Inverse Normal Distribution
The method used for finding the corresponding z-critical value in a normal distribution using the known probability is said to be an inverse normal distribution. The inverse normal distribution is a continuous probability distribution with a family of two parameters.
Mean, Median, Mode
It is a descriptive summary of a data set. It can be defined by using some of the measures. The central tendencies do not provide information regarding individual data from the dataset. However, they give a summary of the data set. The central tendency or measure of central tendency is a central or typical value for a probability distribution.
Z-Scores
A z-score is a unit of measurement used in statistics to describe the position of a raw score in terms of its distance from the mean, measured with reference to standard deviation from the mean. Z-scores are useful in statistics because they allow comparison between two scores that belong to different normal distributions.


Trending now
This is a popular solution!

Step by step
Solved in 3 steps with 2 images


