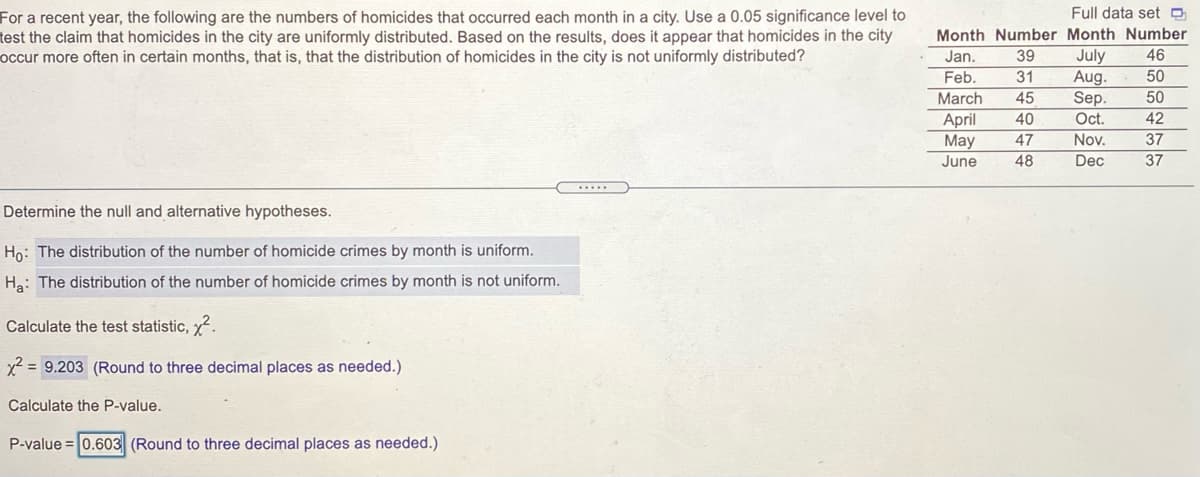
Full data set O For a recent year, the following are the numbers of homicides that occurred each month in a city. Use a 0.05 significance level to test the claim that homicides in the city are uniformly distributed. Based on the results, does it appear that homicides in the city occur more often in certain months, that is, that the distribution of homicides in the city is not uniformly distributed? Month Number Month Number 39 46 July Aug. Sep. Jan. Feb. 31 50 March 45 50 April May 40 47 Oct. 42 Nov. 37 June 48 Dec 37 ..... Determine the null and alternative hypotheses. Ho: The distribution of the number of homicide crimes by month is uniform. Ha: The distribution of the number of homicide crimes by month is not uniform. Calculate the test statistic, y. x2 = 9.203 (Round to three decimal places as needed.) Calculate the P-value. P-value =lo 603 (Round to three decimal places as needed.) |||| |

Glencoe Algebra 1, Student Edition, 9780079039897, 0079039898, 2018
18th Edition
ISBN:9780079039897
Author:Carter
Publisher:Carter
Chapter10: Statistics
Section10.4: Distributions Of Data
Problem 19PFA
icon
Related questions
Topic Video
Question
100%
Help fund p value using calculator
Full data set D
For a recent year, the following are the numbers of homicides that occurred each month in a city. Use a 0.05 significance level to
test the claim that homicides in the city are uniformly distributed. Based on the results, does it appear that homicides in the city
occur more often in certain months, that is, that the distribution of homicides in the city is not uniformly distributed?
Month Number Month Number
Jan.
39
July
Aug.
Sep.
46
Feb.
31
50
March
45
50
Oct.
42
April
Мay
June
40
47
Nov.
37
48
Dec
37
.....
Determine the null and alternative hypotheses.
Ho: The distribution of the number of homicide crimes by month is uniform.
Ha: The distribution of the number of homicide crimes by month is not uniform.
Calculate the test statistic, x.
x2 = 9.203 (Round to three decimal places as needed.)
Calculate the P-value.
P-value = 0.603 (Round to three decimal places as needed.)
ロ ||| |
Transcribed Image Text:Full data set D For a recent year, the following are the numbers of homicides that occurred each month in a city. Use a 0.05 significance level to test the claim that homicides in the city are uniformly distributed. Based on the results, does it appear that homicides in the city occur more often in certain months, that is, that the distribution of homicides in the city is not uniformly distributed? Month Number Month Number Jan. 39 July Aug. Sep. 46 Feb. 31 50 March 45 50 Oct. 42 April Мay June 40 47 Nov. 37 48 Dec 37 ..... Determine the null and alternative hypotheses. Ho: The distribution of the number of homicide crimes by month is uniform. Ha: The distribution of the number of homicide crimes by month is not uniform. Calculate the test statistic, x. x2 = 9.203 (Round to three decimal places as needed.) Calculate the P-value. P-value = 0.603 (Round to three decimal places as needed.) ロ ||| |
Expert Solution
trending now

Trending now

This is a popular solution!

steps

Step by step

Solved in 2 steps with 1 images

Blurred answer
Knowledge Booster
Algebraic Operations
Learn more about
Need a deep-dive on the concept behind this application? Look no further. Learn more about this topic, statistics and related others by exploring similar questions and additional content below.
Recommended textbooks for you
Glencoe Algebra 1, Student Edition, 9780079039897…
Algebra
ISBN:
9780079039897
Author:
Carter
Publisher:
McGraw Hill