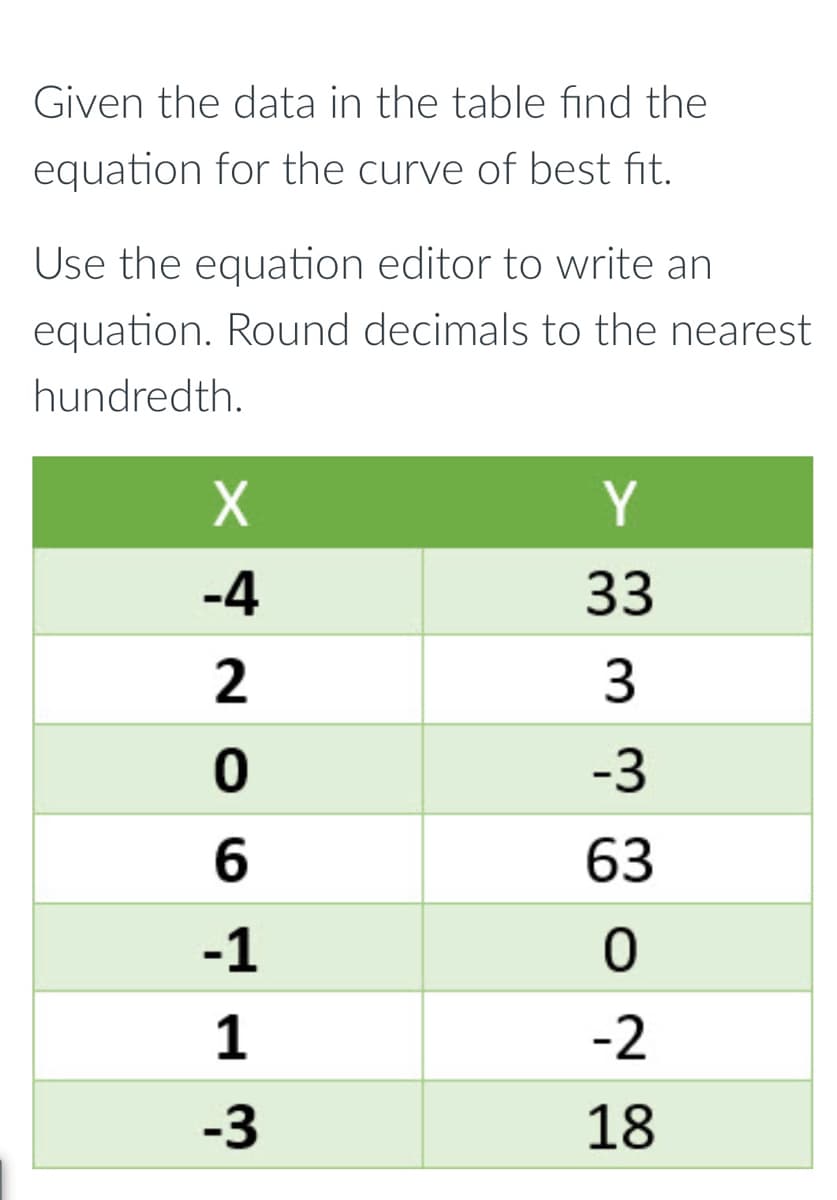
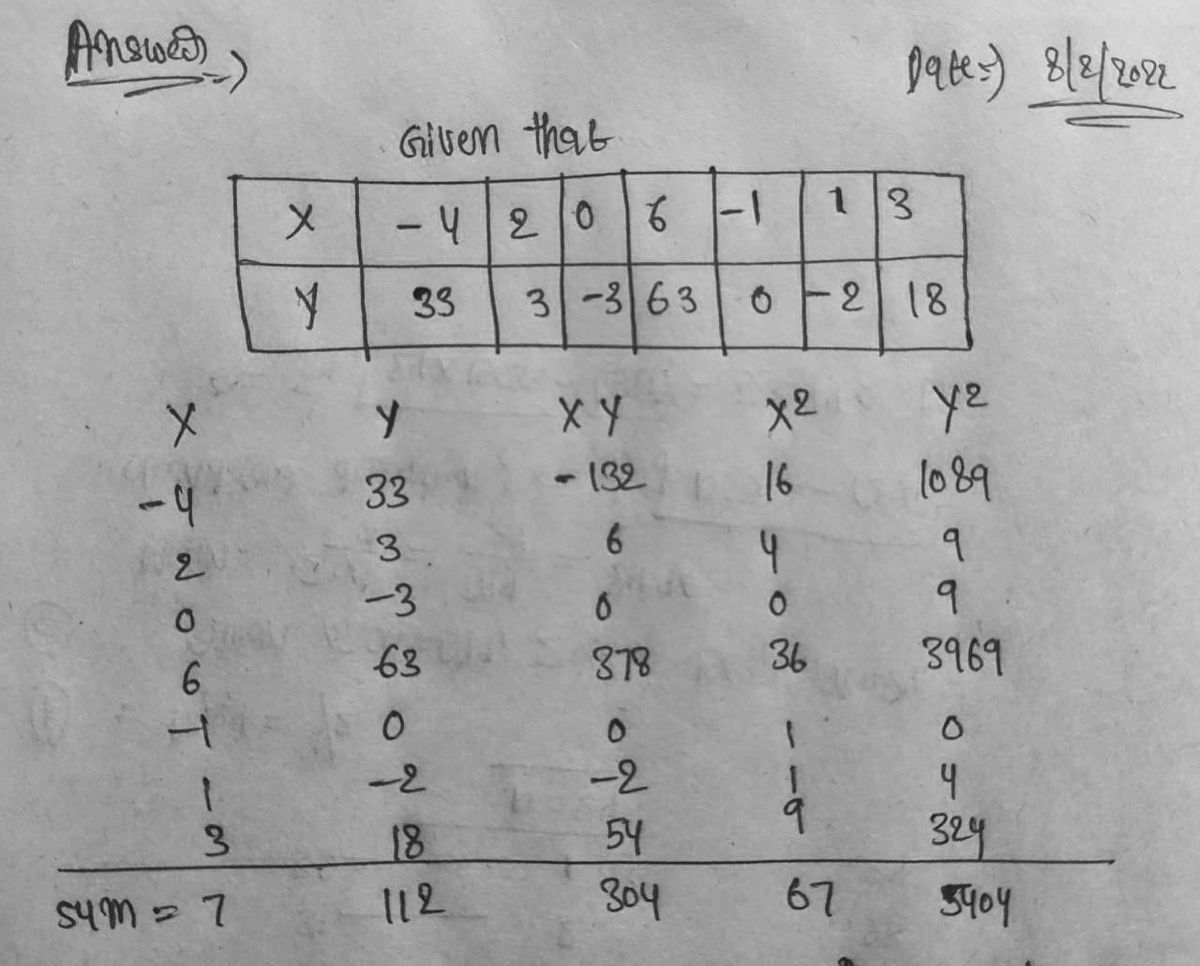
Given the data in the table find the equation for the curve of best fit. Use the equation editor to write an equation. Round decimals to the nearest hundredth. Y -4 33 3 -3 6. 63 -1 1 -2 -3 18


Q: Joe works for a landscaping company. He is cutting lengths of plastic edging for flower beds. For…
A: First plot the graph:
Q: B D Consumer Goods Capital Goods
A:
Q: The scatter plot shows the number of hours worked, x, and the amount of money spent on…
A: Given that - The scatter plot shows the number of hours worked, x, and the amount of money spent on…
Q: For the data given below, answer parts (a) through (f) X - 4 - 2 0. 4. y - 4 - 1 1 4. ..... (b) Find…
A: Given: x -4 -2 0 2 4 y -4 -1 1 4 5
Q: he scatter plot shows the time spent studying, x, and the quiz score, v, for each of 23 students. a)…
A: Given: Aim: To find an equation of the line that is approximately a best fit to the given scatter…
Q: a. Plot a scatter diagram. b. If 60 is the minimum passing grade, below which placement test score…
A: Regression: Regression analysis is used measure the association between two are more variables where…
Q: Use the graph to the right to write an equation of the line. The equation is (Simplify your answer.…
A: The graph of the line is given.
Q: Find the slope of the curve at the given point P y=5−5x2; P(−5,−120).
A:
Q: Use the graph to help you write an equation for a linear model giving V, the value of the CA wine…
A: Let Yi and Vi denote the no. of years after 2000 and the value of the CA wine market(in billions of…
Q: Pleose find 0) the slope point P end (b) an equotion
A: The given curve is y = x2 - 5 To find slope we have to differentiate and find dy/dx
Q: out a coupon for 70% off the price of a ticket. a. Write an equation for the situation, where y is…
A:
Q: Use the above scatter plot to decide whether the linear model fits the data well. O The function is…
A: From the above information
Q: 1500
A:
Q: Determine the slope of the curve ?2 + ?2 − 6? − 4? − 21 = 0 at the point (0,7).
A: Assuming the given equation is: x2+y2-6x-4y-21=0 point (0, 7)
Q: Plot the points listed in the table below (label the scale and axes). y -2 -3 -1 -1 1 1 2
A:
Q: In a nonlinear or curvilinear relationship, as the X scores change, the Y scores alter their…
A: Non-linear or curvilinear relationship: If the relationship between X and Y is not approximated by a…
Q: Which equation below would be parallel to the line shown in the graph below? -5 4 3 -2 1
A: Two lines are parallel if their slopes are equal. If a line passes through the points x1, y1 and x2,…
Q: Write the slope-intercept form of the equation of the line passing through the points (6, -6) and…
A: The given two points are (6,-6) and (-6,8).
Q: The scatter plot shows the time spent texting, x, and the time spent exercising, y, by each of 23…
A: a) The scatter plot shows a straight line . So to find the equation of line of best of fit, linear…
Q: (a) Write an approximate equation of the line of best fit for the data. It doesn't have to be the…
A: The scatter plot shows the time spent watching TV, 'x' doing homework, 'y' by each of the 24…
Q: (a) Write an approximate equation of the line of best fit for the data. It doesn't have to be the…
A: A scatter plot is given, to find out the approximate line of regression and to predict the score…
Q: 7. Find the slope of the curve x^2 - 3xy + y^2 - 4x + 2y + 1 = 0 at the point (1,-1). Enter your…
A:
Q: Find the equation of the curve that joins the following points. Hint: Use common differences. (a)…
A: As per company guidelines we are allowed to solve one question at a time so i am solving first one…
Q: he scatter.plot shows the time spent texting, X, and the time spent exercising, y, by each of 23…
A: a Looking at the scatter points , we can approximate that the line passing through 0,10 and 10,0…
Q: Figure BCDE is given a dilation with a scale factor of 5. What will be the coordinates of Point C? E…
A:
Q: The accompanying scatterplot shows the size (in square feet) and selling prices for homes in a…
A: a) Draw line x=1500 , then y coordinate of point where it touches line x=1500is predicted value .…
Q: A scatter plot was made to show the value of certain cars based on the age of the car in years. The…
A: Given equation of the scatter plots trend line is Y= -1700x + 32000
Q: Student Class Grade Solve the following problems using the scatter plot. Refer to previous slides if…
A: Solution : Given : Scatter plot of Students Absence vs Grades From given scatter plot, data in…
Q: Given the data in the table use the equation editor to write an equation for the curve of best fit.…
A: Given: x y -3 1.125 2 5 0 2 6 65 -1 1.5 1 3 -4 1.0625
Q: Name: Date: Drow an example of a line that would hove a positive slope: At what point does the line…
A: The slope of the line is positive. Therefore, the angle between the line and the x-axis is less than…
Q: A scatter plot was made to show the value of certain cars based on the age of the car in years. The…
A:
Q: Find the slope of the line passing through the pair of points. (If an answer does not exist, enter…
A:
Q: -3 |-2 |-1 1 3 2. Suppose you're given the following data set: y 0 78 -3 3 -8 -7 i] Sketch a…
A: (i) scatter plot of data
Q: The graph shows the total amount of money wagered on the Kentucky Derby. Find the equation for the…
A: Slope-intercept form : y=mx+c where m is slope and c is y-intercept m=dydx
Q: The graph shows the amount of time required to build a scale model of r inches. 24 20 16 Inches What…
A:
Q: The scatter plot above depicts the relationship between a elevation measured in Meters (m) and…
A: Given: The scatter plot is shown as The equation of the line of best fit is C=22.5-1160m Elevation…
Q: -3 -2 -1 123 2. Suppose you're given the following data set: -3 3. -8 -7 8 i) Sketch a scatterplot…
A:
Q: The scatter plot shows the time spent texting, x, and the time spent exercising, y, by each of 23…
A: given The scatter plot shows the time spent texting, x, and the time spent exercising, y, by each…
Q: Find an equation for the line that passes through the point P(-4,2) and is parallel to the line x +y…
A:
Q: Area of Ope Which of the following is the equation of the line of best fit? O A. y = -r + 160 %3D
A:
Q: Write a story to describe a situation that would produce the following graph for the relationship…
A: A train started his travel from point A to point M .The train reaches the speed of 45 miles per hour…
Q: (a) Find the slope of the graph of c. What does it represent? (b) What is the dosage for a newborn?
A:
Q: architect wants to determine the relationship between the heights (in feet) of a building and the…
A: Given Data : X = stories Y = Height 64 841 54 725 40 635 31 616 45 615 38 582 42…
Q: The estimated equation is? Interpret the intercept.? Interpret the slope coefficient.?
A: Hello. Since your question has multiple sub-parts, we will solve first three sub-parts for you. If…
Q: Use the regression capabilities of a graphing calculator to find the equation for the line of best…
A: Use Ti calculator to find the equation for the line of best fit as follows: Select STAT > Edit…
Q: Use DESMOS to answer the following question: The table shows the amount of time students in a class…
A: As per your request, I have used desmos to solve this problem. The scatter plot of the given data…
Q: equation of the line of best fit for the data. It doesn't om part (a), predict the quiz score for a…
A: Given: Number of students is 24 Spent for studying 50 minutes
Q: The table below shows the world population growing at a rapid rate. ° Here are the questions…
A: We want to find Write an equation in slope-intercept form that best represents this data.

Trending now
This is a popular solution!

Step by step
Solved in 2 steps with 2 images

- Find the equation of the curve that joins the following points. Hint: Use common differences. (a) (1,1),(0,1),(2,-5),(-1,-5)A store is having a sale in which all items are marked 30% off. Part A Which equation represents the selling price, s, in dollars, of an item originally priced p dollars after a markdown of 30%?Find the slope of the curve at the given point P y=5−5x2; P(−5,−120).
- Use the regression capabilities of a graphing calculator to find the equation for the line of best fit for the following points. Round decimals off to the nearest hundredth. x y 1 9 2 8 3 8 4 5 5 6 6 4 7 2 Note: "y =" is already written fill in the right side of the equation only y =L5Q2.The curve of best fit is given as y = 3 - 2x - 2x2. Find the value of y when x = -1.Determine the slope of the curve ?2 + ?2 − 6? − 4? − 21 = 0 at the point (0,7).
- Given X=45.5, μ=40, and σ=2, indicate on the curve where the given X value would be.Roger, an account analyts made a regression analysis between sales (in P1000) and price (in pesos) resulted in the following equation: y = 50,000 - 9X The above equation implies that an2.4 q.5PLEASE SHOW POINTS AND WHERE THEY SHOULD BE PLOTTED EXACTLY, THANK YOU
- which equation has a rate of change that is greater than the rate of change shown in the graph ? select all that applyfind a linear equation in slope intercept form that best models the following graphY=_x+_ Round your answer to two decimal placesFind the length of the following curve. If you have a grapher, you may want to graph the curve to see what it looks like. y=1/27(9x^2+6)^3/2 from x=0 to x=3