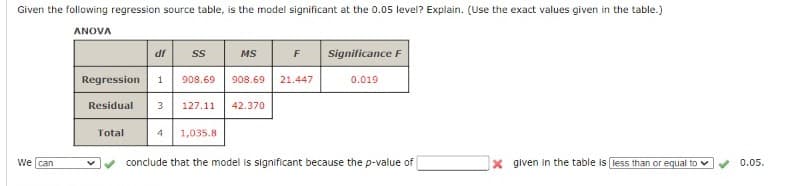
Given the following regression source table, is the model significant at the 0.05 level? Explain. (Use the exact values given in the table.) ANOVA df MS Significance F Regression 1 908.69 Residual 3 127.11 908.69 21.447 0.019 42.370 Total 4 1,035.8 We can conclude that the model is significant because the p-value of x given in the table is less than or equal to v 0.05.


Q: The owners of a franchise of fast food restaurants want to study the relationship between annual…
A:
Q: Please answer the following true or false questions :) T/F: A plot of the residuals indicates that…
A: True and False
Q: Use the following ANOVA table for regression to answer the questions. Analysis of Variance Source…
A: ANOVA is a statistical method used to compare the null hypothesis and alternative hypothesis using F…
Q: Using test data on 43 vehicles, an analyst fitted a regression to predict CityMPG (miles per gallon…
A: It is needed to test the overall fit of the model.
Q: A researcher interested in explaining the level of foreign reserves for the country of Barbados…
A: Hey, since there are multiple subparts posted, we will answer the first three subparts. If you want…
Q: Use the following ANOVA table for regression to answer the questions. Response: Y Source DF Sum Sq…
A: F-statistic is 3.02 The p-value is 0.083
Q: GIven the following ANOVA table: Source DF MS Regression 1,800.0 900.0 1 1,800.00 20.00 Error 10…
A: Anova table is given in the question.
Q: A study was conducted to determine if the following factors are associated with quality of life…
A: The answer is in the next step.
Q: Based on the ANOVA table given, is there enough evidence at the 0.050.05 level of significance to…
A: Based on the ANOVA table given, is there enough evidence at the 0.050.05 level of significance to…
Q: a) Test whether ? is significant. Give reasons for your answer. b) Perform the F Test making sure…
A: Given : Predictor Coef StDev t-ratio p-value Constant…
Q: 4. Proposed Model in Improving the Satisfaction Level of the JRU students SUMMARY OUTPUT Regression…
A: Given, The summary output of the model id given, To find, Interpret the given summary output.
Q: effect size is determined by Pearson’s r.
A: For a bivariate regression, the assessment of effect size is determined by Pearson’s r. Basically,…
Q: What is solution of following question? Dex Research Limited conducted a research to investigate…
A: Dependent variable: annual credit card charges, Independent variables: annual income, household…
Q: An economist is interested in forecasting future lumber demand. She uses annual time series data…
A: Given that: Durbin-Watson statistic is 1.60 The significance level is 0.05.
Q: For each of the following scenarios, select the test (from the choices below), that is most…
A: 1) Do married people who have had a greater number of sexual partners in the past report a greater…
Q: Consider the following ANOVA table for a multiple regression model. Source df SS MS F Regression…
A:
Q: An educational researcher would like to predict well-being from a set of four predictor variables…
A: As given, k : the number of predicted variables. = 4 N: A sample size of participants. = 45…
Q: The service regresses the number of complaints lodged against an employee last year on the hourly…
A:
Q: For the data and sample regression equation shown below, do the following. a. Decide, at the 10%…
A: Given: n = 4 Y = -1.5 + 1.1X Formula Used: Test-statistic t = b-βSe Confidence interval = b ± t*se
Q: A health analyst studied the relationship between blood pressure and independent variables age…
A: Given Information: The dependent variable is Blood pressure. The independent variables are age,…
Q: Consider the results in Table 5. After running the regression, we test whether the coefficients of…
A: Consider the given table that shows the regression analysis of the data. The value of the…
Q: State the degrees of freedom for the F test for overall significance. (c-1) Calculate the F…
A:
Q: The following shows incomplete ANOVA output: ANOVA Regression Residual Total Calculate: P= 1 df 1 8…
A: Given that dfRegression = 1 , dfResidual = 8 , dfTotal = 9 SSTotal = 2335 , MSResidual = 140.1…
Q: Use the following ANOVA table for regression to answer the questions. Response: Y Source DF Sum Sq…
A: From the output The F-statistics is 13.05. The p-value is 0.000
Q: Use the following ANOVA table for regression to answer the questions. Analysis of Variance Source…
A: The null and alternative hypotheses are defined as follows: H0: The model is not effective. H1: The…
Q: Based on the ANOVA table given, is there enough evidence at the 0.05 level of significance to…
A: In the given problem, We have given that an ANOVA table that contains the summary results of a…
Q: Consider the following ANOVA table for a simple linear regression. Source Sum Degrees of…
A:
Q: 3. The following tables show the result of statistical analysis in a study titled "Correlates of…
A: Introduction: A multiple regression analysis output is given.
Q: A researcher is interested in determining the required sample size for testing the change in R…
A:
Q: A multiple regression analysis to assess the effects of age and wage ($/hr) on productivity units…
A: Regression Analysis: Regression analysis is used measure the association between two or more…
Q: Based on the ANOVA table given, is there enough evidence at the 0.05 level of significance to…
A: The significance value is 0.497712
Q: Use the following information from a multiple regression analysis b, = 3 n= 20 b, = 2 So, = 1.1 S, =…
A:
Q: Given the regression output below and a significance level of 99%, can we reject the null hypothesis…
A: Given that p-value =0.000 Level of significance =0.01
Q: A simple regression analysis is performed to relate maintenance expense (Y, dollars per month) to…
A:
Q: Shown below is a portion of a computer output for regression analysis relating to Y (dependent…
A: Hello, Thank you for posting your question here. Since you have posted a question with multiple…
Q: Охудеn Тетрerature consumption (ml/g/hr) ( C) - 18. - 15. - 10. - 5. 0. 5. 5.2 4.7 4.5 3.6 3.4 3.1…
A: Given, Let x = Temperature (0C) y = Oxygen consumption (ml/g/hr) n = 8 we calculate the…
Q: Use the following ANOVA table for regression to answer the questions. Analysis of Variance Source DF…
A:
Q: The service regresses the number of complaints lodged against an employee last year on the hourly…
A: Hey, since there are multiple subparts posted, we will answer the first three subparts. If you want…
Q: The following ANOVA table is generated from a data set considering one regressor: Source of F- F- P-…
A: Here given anova table. We have to calculate R^2 of the best - fit line for the regression analysis
Q: In a multiple regression analysis, two independent variables are considered and the sample size is…
A:
Q: Based on the table below, what is the value of SST? (round to 2 decimal places) ANOVA df SS MS F…
A: Given: SSRegression=28.06SSResidual=12.09 The value of Sum of squares of total SST is obtained as…
Q: Consider the following ANOVA table for a multiple regression model. Source df SS MS F Regression 3…
A: Hello! As you have posted more than 3 sub parts, we are answering the first 3 sub-parts. In case…
Q: The attached results are for a multiple regression study of smartphone addiction (SSA-SV) proneness…
A: The study is based on smartphone addiction (SSA-SV) proneness in relation to 1) Gender 2)Age 3)…
Q: Using test data on 43 vehicles, an analyst fitted a regression to predict CityMPG (miles per gallon…
A: a) From the output The F-statistics is 27.90. The p-value is 8.35×10⁻¹⁰ Decision rule: If p-value ≤…
Q: Use the following ANOVA table for regression analysis to compute the adjusted R value. ANOVA df SS…
A:
Q: The following ANOVA table is generated from a data set considering one regressor: F- P- F- df SS MS…
A: From the Anova table R2 = ?
Q: A researcher interested in explaining the level of foreign reserves for the country of Barbados…
A: From the given outputThe regression equation is FR= 5491.38 + 85.39OIL - -377.08EXP -396.99FDIa)…
Q: Given the Analysis of Variance (ANOVA) for the simple linear regression as belo Table Q5: ANOVA…
A: Solution

Step by step
Solved in 2 steps

- Find the equation of the regression line for the following data set. x 1 2 3 y 0 3 4For the following exercises, use Table 4 which shows the percent of unemployed persons 25 years or older who are college graduates in a particular city, by year. Based on the set of data given in Table 5, calculate the regression line using a calculator or other technology tool, and determine the correlation coefficient. Round to three decimal places of accuracyA researcher interested in explaining the level of foreign reserves for the country of Barbados estimated the following multiple regression model using yearly data spanning the period 2001 to 2016: ??=?+????+????+???? Where FR = yearly foreign reserves ($000’s), OIL = annual oil prices, EXP = yearly total exports ($000’s) and FDI = annual foreign direct investment ($000’s). The sample of data was processed using MINITAB and the following is an extract of the output obtained: Predictor Coef StDev t-ratio p-value Constant 5491.38 2508.81 2.1888 0.0491OIL 85.39 18.46 4.626 0.0006EXP -377.08 112.19 * 0.0057FDI -396.99 160.66 -2.471 ** S = 2.45 R-sq = 96.3% R-sq(adj) = 95.3% Analysis of VarianceSource DF SS…
- A researcher interested in explaining the level of foreign reserves for the country of Barbados estimated the following multiple regression model using yearly data spanning the period 2001 to 2016: ??=?+????+????+???? Where FR = yearly foreign reserves ($000’s), OIL = annual oil prices, EXP = yearly total exports ($000’s) and FDI = annual foreign direct investment ($000’s). The sample of data was processed using MINITAB and the following is an extract of the output obtained: Predictor Coef StDev t-ratio p-value Constant 5491.38 2508.81 2.1888 0.0491 OIL 85.39 18.46 4.626 0.0006 EXP -377.08 112.19 * 0.0057 FDI -396.99 160.66 -2.471 ** S = 2.45 R-sq = 96.3% R-sq(adj) = 95.3%…A researcher interested in explaining the level of foreign reserves for the country of Barbados estimated the following multiple regression model using yearly data spanning the period 2001 to 2016: ??=?+????+????+???? Where FR = yearly foreign reserves ($000’s), OIL = annual oil prices, EXP = yearly total exports ($000’s) and FDI = annual foreign direct investment ($000’s). The sample of data was processed using MINITAB and the following is an extract of the output obtained: Predictor Coef StDev t-ratio p-value Constant 5491.38 2508.81 2.1888 0.0491 OIL 85.39 18.46 4.626 0.0006 EXP -377.08 112.19 * 0.0057 FDI -396.99 160.66 -2.471 ** S = 2.45 R-sq = 96.3% R-sq(adj) = 95.3% Analysis of Variance Source DF SS MS F p Regression 3 1991.31 663.77 ? ?? Error 12 77.4 6.45 Total 15 a). Fill in the missing values ‘*’, ‘**’,…A researcher interested in explaining the level of foreign reserves for the country of Barbados estimated the following multiple regression model using yearly data spanning the period 2001 to 2016: ??=?+????+????+???? Where FR = yearly foreign reserves ($000’s), OIL = annual oil prices, EXP = yearly total exports ($000’s) and FDI = annual foreign direct investment ($000’s). The sample of data was processed using MINITAB and the following is an extract of the output obtained: Predictor Coef StDev t-ratio p-value Constant 5491.38 2508.81 2.1888 0.0491 OIL 85.39 18.46 4.626 0.0006 EXP -377.08 112.19 * 0.0057 FDI -396.99 160.66 -2.471 ** S = 2.45 R-sq = 96.3% R-sq(adj) = 95.3% Analysis of Variance Source DF SS MS F p…
- A researcher interested in explaining the level of foreign reserves for the country of Barbados estimated the following multiple regression model using yearly data spanning the period 2001 to 2016: ??=?+????+????+???? Where FR = yearly foreign reserves ($000’s), OIL = annual oil prices, EXP = yearly total exports ($000’s) and FDI = annual foreign direct investment ($000’s). The sample of data was processed using MINITAB and the following is an extract of the output obtained: Predictor Coef StDev t-ratio p-value Constant 5491.38 2508.81 2.1888 0.0491 Oil 85.39 18.46 4.626 0.0006 EXP -377.08 112.19 * 0.0057 FDI -396.99 160.66 -2.471 ** S = 2.45 R – sq = 96.3% R – sq (adj) = 95.3% Analysis of Variance Source DF S MS…A researcher interested in explaining the level of foreign reserves for the country of Barbados estimated the following multiple regression model using yearly data spanning the period 2001 to 2016: ??=?+????+????+???? Where FR = yearly foreign reserves ($000’s), OIL = annual oil prices, EXP = yearly total exports ($000’s) and FDI = annual foreign direct investment ($000’s). The sample of data was processed using MINITAB and the following is an extract of the output obtained: Predictor Coef StDev t-ratio p-valueConstant 5491.38 2508.81 2.1888 0.0491OIL 85.39 18.46 4.626 0.0006EXP -377.08 112.19 * 0.0057FDI -396.99 160.66 -2.471 ** S = 2.45 R-sq = 96.3% R-sq(adj) = 95.3%…A researcher interested in explaining the level of foreign reserves for the country of Barbados estimated the following multiple regression model using yearly data spanning the period 2001 to 2016: ??=?+????+????+???? Where FR = yearly foreign reserves ($000’s), OIL = annual oil prices, EXP = yearly total exports ($000’s) and FDI = annual foreign direct investment ($000’s). The sample of data was processed using MINITAB and the following is an extract of the output obtained: Predictor Coef StDev t-ratio p-value Constant 5491.38 2508.81 2.1888 0.0491 OIL 85.39 18.46 4.626 0.0006 EXP -377.08 112.19 * 0.0057 FDI -396.99 160.66 -2.471 ** S = 2.45 R-sq = 96.3% R-sq(adj) = 95.3% Analysis of Variance Source DF SS MS F p Regression 3 1991.31 663.77 ? ?? Error 12 77.4 6.45 Total 15 Fill in the missing values ‘*’, ‘**’, ‘?’and ‘??’…
- A researcher interested in explaining the level of foreign reserves for the country of Barbados estimated the following multiple regression model using yearly data spanning the period 2001 to 2016: ??=?+????+????+???? Where FR = yearly foreign reserves ($000’s), OIL = annual oil prices, EXP = yearly total exports ($000’s) and FDI = annual foreign direct investment ($000’s). The sample of data was processed using MINITAB and the following is an extract of the output obtained: Predictor Coef StDev t-ratio p-value Constant 5491.38 2508.81 2.1888 0.0491 Oil 85.39 18.46 4.626 0.0006 EXP -377.08 112.19 * 0.0057 FDI -396.99 160.66 -2.471 ** S = 2.45 R – sq = 96.3% R – sq (adj) = 95.3% Analysis of Variance Source…A researcher interested in explaining the level of foreign reserves for the country of Barbados estimated the following multiple regression model using yearly data spanning the period 2001 to 2016: ??=?+????+????+???? Where FR = yearly foreign reserves ($000’s), OIL = annual oil prices, EXP = yearly total exports ($000’s) and FDI = annual foreign direct investment ($000’s). The sample of data was processed using MINITAB and the following is an extract of the output obtained: Predictor Coef StDev t-ratio p-value Constant 5491.38 2508.81 2.1888 0.0491 OIL 85.39 18.46 4.626 0.0006 EXP -377.08 112.19 * 0.0057 FDI -396.99 160.66 -2.471 ** S = 2.45 R-sq = 96.3% R-sq(adj) = 95.3%…A researcher interested in explaining the level of foreign reserves for the country of Barbados estimated the following multiple regression model using yearly data spanning the period 2001 to 2016: ??=?+????+????+???I Where FR = yearly foreign reserves ($000’s), OIL = annual oil prices, EXP = yearly total exports ($000’s) and FDI = annual foreign direct investment ($000’s). The sample of data was processed using MINITAB and the following is an extract of the output obtained: Predictor Coef StDev t-ratio p-value Constant 5491.38 2508.81 2.1888 0.0491 Oil 85.39 18.46 4.626 0.0006 EXP -377.08 112.19 * 0.0057 FDI -396.99 160.66 -2.471 ** S = 2.45 R – sq = 96.3% R – sq (adj) = 95.3% Analysis of Variance Source DF SS MS F P Regression 3 1991.31 663.77 ? ?? Error 12 77.4 6.45 Total 15 e) Perform the F Test making sure to state…


