Use the following information from a multiple regression analysis b, = 3 n= 20 b, = 2 So, = 1.1 S, = 0.9 a. Which variable has the largest slope, in units of a t statistic? b. Construct a 95% confidence interval estimate of the population slope, B,. c. At the 0.05 level of significance, determine whether each independent variable makes a significant contribution to the regression model. On the basis of these results, indicate the independent variables to include in this model. .. a. Which variable has the largest slope, in units of at statistic? The variable X, has the largest slope, with tsTAT = 3.33 (Round two decimal places as needed.) b. Construct a 95% confidence interval estimate of the population slope, B,. - 0.321 sB, s 4.321 (Round to three decimal places as needed.) c. Begin by determining whether X, makes a significant contribution to the regression model. Determine the null and alternative hypotheses. Choose the correct answer below. OA. Ho: B,#0 H,: B, =0 O B. Ho: B, =0 H,: B, <0 C. Họ: B, =0 H;: B, #0 O D. Ho: B, =0 H: B, >0 Compute the test statistic. STAT =D (Round to two decimal places as needed.)
Use the following information from a multiple regression analysis b, = 3 n= 20 b, = 2 So, = 1.1 S, = 0.9 a. Which variable has the largest slope, in units of a t statistic? b. Construct a 95% confidence interval estimate of the population slope, B,. c. At the 0.05 level of significance, determine whether each independent variable makes a significant contribution to the regression model. On the basis of these results, indicate the independent variables to include in this model. .. a. Which variable has the largest slope, in units of at statistic? The variable X, has the largest slope, with tsTAT = 3.33 (Round two decimal places as needed.) b. Construct a 95% confidence interval estimate of the population slope, B,. - 0.321 sB, s 4.321 (Round to three decimal places as needed.) c. Begin by determining whether X, makes a significant contribution to the regression model. Determine the null and alternative hypotheses. Choose the correct answer below. OA. Ho: B,#0 H,: B, =0 O B. Ho: B, =0 H,: B, <0 C. Họ: B, =0 H;: B, #0 O D. Ho: B, =0 H: B, >0 Compute the test statistic. STAT =D (Round to two decimal places as needed.)

Chapter4: Linear Functions
Section: Chapter Questions
Problem 30PT: For the following exercises, use Table 4 which shows the percent of unemployed persons 25 years or...

Related questions
Question
please compute the test statistic
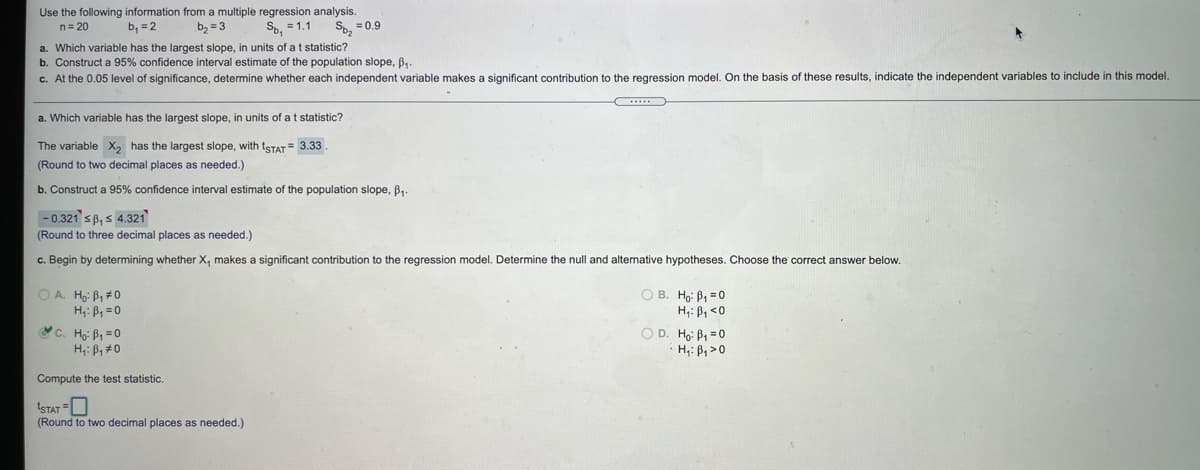
Transcribed Image Text:Use the following information from a multiple regression analysis
b, = 3
n= 20
b, =2
Sp, = 1.1
So, = 0.9
a. Which variable has the largest slope, in units of at statistic?
b. Construct a 95% confidence interval estimate of the population slope, B.
c. At the 0.05 level of significance, determine whether each independent variable makes a significant contribution to the regression model. On the basis of these results, indicate the independent variables to include in this model.
..
a. Which variable has the largest slope, in units of at statistic?
The variable X, has the largest slope, with tsTAT = 3.33
(Round
two decimal places as needed.)
b. Construct a 95% confidence interval estimate of the population slope, B,.
- 0.321 sB, s 4.321
(Round to three decimal places as needed.)
c. Begin by determining whether X, makes a significant contribution to the regression model. Determine the null and alternative hypotheses. Choose the correct answer below.
OA. Ho: B,#0
H,: B, =0
O B. Ho: B, =0
H,: B, <0
C. Họ: B, =0
H: B, #0
O D. Ho: B1 =0
H;: B, >0
Compute the test statistic.
STAT =D
(Round to two decimal places as needed.)
Expert Solution
This question has been solved!
Explore an expertly crafted, step-by-step solution for a thorough understanding of key concepts.

Step by step
Solved in 2 steps with 2 images

Recommended textbooks for you

Glencoe Algebra 1, Student Edition, 9780079039897…
Algebra
ISBN:
9780079039897
Author:
Carter
Publisher:
McGraw Hill

Functions and Change: A Modeling Approach to Coll…
Algebra
ISBN:
9781337111348
Author:
Bruce Crauder, Benny Evans, Alan Noell
Publisher:
Cengage Learning
Glencoe Algebra 1, Student Edition, 9780079039897…
Algebra
ISBN:
9780079039897
Author:
Carter
Publisher:
McGraw Hill
Functions and Change: A Modeling Approach to Coll…
Algebra
ISBN:
9781337111348
Author:
Bruce Crauder, Benny Evans, Alan Noell
Publisher:
Cengage Learning