given the MS spectrum of CS2 is as well as the relative abundance table of its atomic isotopes. (pictures below) Find a) which molecular isotopes have a mass-to-charge ratio of m/z = 77. b) based on your answer to a) calculate the expected peak intensity of the spectrum using the elements in the table and compare it with the actual result
given the MS spectrum of CS2 is as well as the relative abundance table of its atomic isotopes. (pictures below) Find a) which molecular isotopes have a mass-to-charge ratio of m/z = 77. b) based on your answer to a) calculate the expected peak intensity of the spectrum using the elements in the table and compare it with the actual result

Chapter7: Statistical Data Treatment And Evaluation
Section: Chapter Questions
Problem 7.27QAP

Related questions

Question
Pls do fast within 5 minutes and i will give like for sure
Solution must be in typed form
given the MS spectrum of CS2 is as well as the relative abundance table of its atomic isotopes. (pictures below)
Find
a) which molecular isotopes have a mass-to-charge ratio of m/z = 77.
b) based on your answer to a) calculate the expected peak intensity of the spectrum using the elements in the table and compare it with the actual result (2.6%)
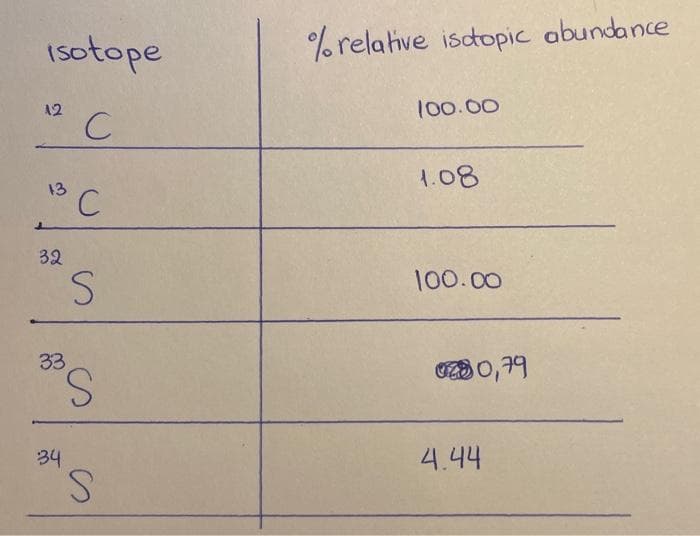
Transcribed Image Text:Isotope
C
12
13
32
'C
33
34
S
S
S
% relative isotopic abundance
100.00
1.08
100.00
0280,79
4.44
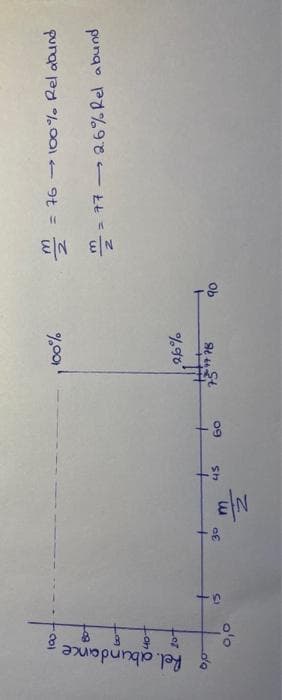
Transcribed Image Text:8
& Rel. abundance;
وام
80-
fo
40-
20+
0,0
-n
30
EN
45
60
100%
26%
-4778
H
90
N|3 N/3
2
= 76 → 100% Rel abund
277 2.6% Rel abund
Expert Solution
This question has been solved!
Explore an expertly crafted, step-by-step solution for a thorough understanding of key concepts.

Step by step
Solved in 3 steps

Knowledge Booster


Learn more about
Need a deep-dive on the concept behind this application? Look no further. Learn more about this topic, chemistry and related others by exploring similar questions and additional content below.Recommended textbooks for you

EBK A SMALL SCALE APPROACH TO ORGANIC L
Chemistry
ISBN:
9781305446021
Author:
Lampman
Publisher:
CENGAGE LEARNING - CONSIGNMENT
EBK A SMALL SCALE APPROACH TO ORGANIC L
Chemistry
ISBN:
9781305446021
Author:
Lampman
Publisher:
CENGAGE LEARNING - CONSIGNMENT