The following table contains some data showing the effect of molar concentration of a solution on the absorbance (optical density) reading from a spectrophotometer. Concentration (M) 0.13 0.28 0.43 0.58 0.73 0.88 1.03 1.18 1.33 1.48 Optical Density No Does the solution in your graph follow Beer's Law? What is the concentration of a solution that has an Optical Density of 0.21? (Give units in your answer). 0.21M Submit Answer Incorrect. Tries 37/99 Previous Tries 0.18 0.38 0.56 0.71 0.85 0.96 1.06 To assist in graphing, right click on this excel spreadsheet file, save it to your computer, and open it in Excel. Enter the above data in the appropriate spaces in the spreadsheet. Select the graph that is created, and print it in portrait orientation. What is the concentration of a solution that has an Optical Density of 0.91? (Give units in your answer). 0.81 M 1.13 1.19 1.23 Use this graph as a model for drawing your own graph. If the line does not cover the entire vertical range of the Y axis, you should change your Y axis values so the graph covers most of the page and values can be read from the graph with greater precision. Use your graph to answer the following questions. The Absorbance, or Optical Density, of a solution for a particular wavelength of light is given by log(Io/I), where I, is the incident light on a sample and I is the transmitted light. Beer's Law states that the the Optical Density of a substance in solution is directly proportional to its concentration. Not all substances follow Beer's Law, but a calibration graph of Optical Density versus concentration can still be used to measure concentrations of unknown solutions.
The following table contains some data showing the effect of molar concentration of a solution on the absorbance (optical density) reading from a spectrophotometer. Concentration (M) 0.13 0.28 0.43 0.58 0.73 0.88 1.03 1.18 1.33 1.48 Optical Density No Does the solution in your graph follow Beer's Law? What is the concentration of a solution that has an Optical Density of 0.21? (Give units in your answer). 0.21M Submit Answer Incorrect. Tries 37/99 Previous Tries 0.18 0.38 0.56 0.71 0.85 0.96 1.06 To assist in graphing, right click on this excel spreadsheet file, save it to your computer, and open it in Excel. Enter the above data in the appropriate spaces in the spreadsheet. Select the graph that is created, and print it in portrait orientation. What is the concentration of a solution that has an Optical Density of 0.91? (Give units in your answer). 0.81 M 1.13 1.19 1.23 Use this graph as a model for drawing your own graph. If the line does not cover the entire vertical range of the Y axis, you should change your Y axis values so the graph covers most of the page and values can be read from the graph with greater precision. Use your graph to answer the following questions. The Absorbance, or Optical Density, of a solution for a particular wavelength of light is given by log(Io/I), where I, is the incident light on a sample and I is the transmitted light. Beer's Law states that the the Optical Density of a substance in solution is directly proportional to its concentration. Not all substances follow Beer's Law, but a calibration graph of Optical Density versus concentration can still be used to measure concentrations of unknown solutions.

Principles of Instrumental Analysis
7th Edition
ISBN:9781305577213
Author:Douglas A. Skoog, F. James Holler, Stanley R. Crouch
Publisher:Douglas A. Skoog, F. James Holler, Stanley R. Crouch
Chapter21: Surface Characterization By Spectroscopy And Microscopy
Section: Chapter Questions
Problem 21.14QAP

Related questions

Question
Transcribed Image Text:Timer
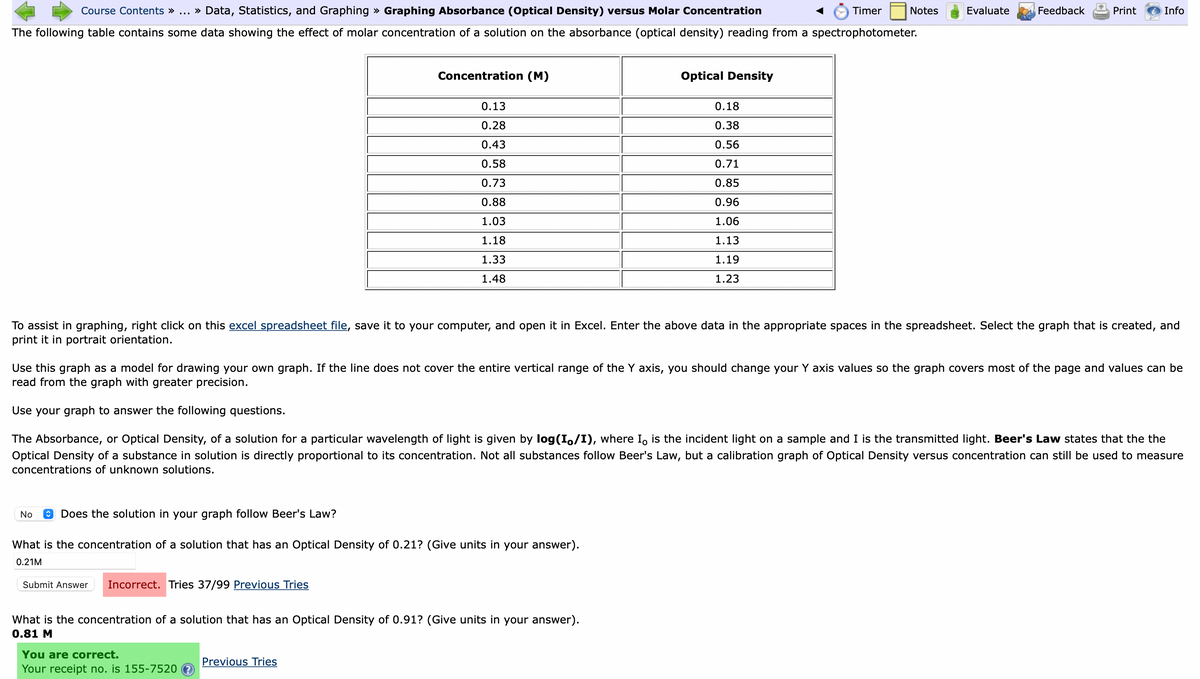
Course Contents » ... » Data, Statistics, and Graphing » Graphing Absorbance (Optical Density) versus Molar Concentration
The following table contains some data showing the effect of molar concentration of a solution on the absorbance (optical density) reading from a spectrophotometer.
No
↑ Does the solution in your graph follow Beer's Law?
Concentration (M)
Submit Answer Incorrect. Tries 37/99 Previous Tries
0.13
0.28
0.43
0.58
0.73
0.88
1.03
1.18
1.33
1.48
What is the concentration of a solution that has an Optical Density of 0.21? (Give units in your answer).
0.21M
You are correct.
Your receipt no. is 155-7520 ?
What is the concentration of a solution that has an Optical Density of 0.91? (Give units in your answer).
0.81 M
Previous Tries
Optical Density
To assist in graphing, right click on this excel spreadsheet file, save it to your computer, and open it in Excel. Enter the above data in the appropriate spaces in the spreadsheet. Select the graph that is created, and
print it in portrait orientation.
Notes
0.18
0.38
0.56
0.71
0.85
0.96
1.06
1.13
1.19
1.23
Use this graph as a model for drawing your own graph. If the line does not cover the entire vertical range of the Y axis, you should change your Y axis values so the graph covers most of the page and values can be
read from the graph with greater precision.
Use your graph to answer the following questions.
The Absorbance, or Optical Density, of a solution for a particular wavelength of light is given by log(10/I), where I is the incident light on a sample and I is the transmitted light. Beer's Law states that the the
Optical Density of a substance in solution is directly proportional to its concentration. Not all substances follow Beer's Law, but a calibration graph of Optical Density versus concentration can still be used to measure
concentrations of unknown solutions.
Evaluate
Feedback
Print
Info
Expert Solution
This question has been solved!
Explore an expertly crafted, step-by-step solution for a thorough understanding of key concepts.

This is a popular solution!

Trending now
This is a popular solution!

Step by step
Solved in 4 steps with 2 images

Knowledge Booster


Learn more about
Need a deep-dive on the concept behind this application? Look no further. Learn more about this topic, chemistry and related others by exploring similar questions and additional content below.Recommended textbooks for you
Principles of Instrumental Analysis
Chemistry
ISBN:
9781305577213
Author:
Douglas A. Skoog, F. James Holler, Stanley R. Crouch
Publisher:
Cengage Learning


Chemistry & Chemical Reactivity
Chemistry
ISBN:
9781337399074
Author:
John C. Kotz, Paul M. Treichel, John Townsend, David Treichel
Publisher:
Cengage Learning
Principles of Instrumental Analysis
Chemistry
ISBN:
9781305577213
Author:
Douglas A. Skoog, F. James Holler, Stanley R. Crouch
Publisher:
Cengage Learning
Chemistry & Chemical Reactivity
Chemistry
ISBN:
9781337399074
Author:
John C. Kotz, Paul M. Treichel, John Townsend, David Treichel
Publisher:
Cengage Learning

Chemistry & Chemical Reactivity
Chemistry
ISBN:
9781133949640
Author:
John C. Kotz, Paul M. Treichel, John Townsend, David Treichel
Publisher:
Cengage Learning