Gokul records historical data for gasoline prices to the nearest five cents in the graph and draws a line of best fit. Gasoline Prices Over Time 1.70 1,60 1.50 1.40 1.30 1.20 1.10. Time (in years) Gasoline Price (in dollars/gallon) S661 000Z 1007 2002 2003 Which statement is true? The line is not the line of best fit because it should pass through (1995, 1.15) and (2004, 1.75). A B The line is not the line of best fit because there could be a line drawn that would be closer to more points. The line is the line of best fit because it passes through points that are in the middle of the data set. D The line is the line of best fit because half of the points are above the line and half of the points are below the line.
Gokul records historical data for gasoline prices to the nearest five cents in the graph and draws a line of best fit. Gasoline Prices Over Time 1.70 1,60 1.50 1.40 1.30 1.20 1.10. Time (in years) Gasoline Price (in dollars/gallon) S661 000Z 1007 2002 2003 Which statement is true? The line is not the line of best fit because it should pass through (1995, 1.15) and (2004, 1.75). A B The line is not the line of best fit because there could be a line drawn that would be closer to more points. The line is the line of best fit because it passes through points that are in the middle of the data set. D The line is the line of best fit because half of the points are above the line and half of the points are below the line.

Glencoe Algebra 1, Student Edition, 9780079039897, 0079039898, 2018
18th Edition
ISBN:9780079039897
Author:Carter
Publisher:Carter
Chapter10: Statistics
Section10.2: Representing Data
Problem 14PPS

Related questions

Topic Video
Question
100%
I have no idea how to do this.
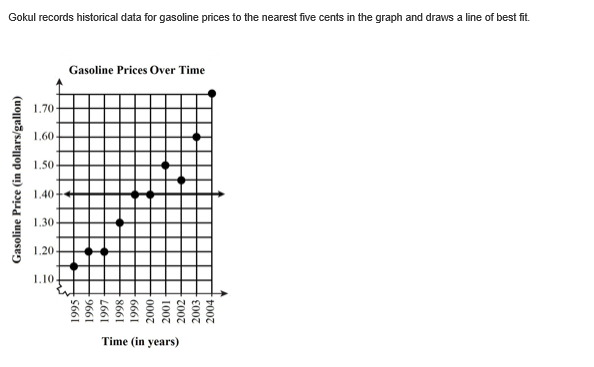
Transcribed Image Text:Gokul records historical data for gasoline prices to the nearest five cents in the graph and draws a line of best fit.
Gasoline Prices Over Time
1.70
1,60
1.50
1.40
1.30
1.20
1.10.
Time (in years)
Gasoline Price (in dollars/gallon)
S661
000Z
1007
2002
2003
Transcribed Image Text:Which statement is true?
The line is not the line of best fit because it should pass through (1995, 1.15) and (2004, 1.75).
A
B
The line is not the line of best fit because there could be a line drawn that would be closer to more points.
The line is the line of best fit because it passes through points that are in the middle of the data set.
D
The line is the line of best fit because half of the points are above the line and half of the points are below the line.
Expert Solution
This question has been solved!
Explore an expertly crafted, step-by-step solution for a thorough understanding of key concepts.

This is a popular solution!

Trending now
This is a popular solution!

Step by step
Solved in 2 steps

Knowledge Booster


Learn more about
Need a deep-dive on the concept behind this application? Look no further. Learn more about this topic, statistics and related others by exploring similar questions and additional content below.Recommended textbooks for you
Glencoe Algebra 1, Student Edition, 9780079039897…
Algebra
ISBN:
9780079039897
Author:
Carter
Publisher:
McGraw Hill

Algebra and Trigonometry (MindTap Course List)
Algebra
ISBN:
9781305071742
Author:
James Stewart, Lothar Redlin, Saleem Watson
Publisher:
Cengage Learning

Glencoe Algebra 1, Student Edition, 9780079039897…
Algebra
ISBN:
9780079039897
Author:
Carter
Publisher:
McGraw Hill
Algebra and Trigonometry (MindTap Course List)
Algebra
ISBN:
9781305071742
Author:
James Stewart, Lothar Redlin, Saleem Watson
Publisher:
Cengage Learning

Holt Mcdougal Larson Pre-algebra: Student Edition…
Algebra
ISBN:
9780547587776
Author:
HOLT MCDOUGAL
Publisher:
HOLT MCDOUGAL
