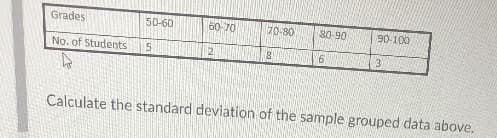
Grades 50-60 60-70 70-80 80-90 90-100 No. of Students 6 3 Calculate the standard deviation of the sample grouped data above. 2.


Q: . Calculate standard deviation and coefficient of variation from the data given below: Mid-points :…
A:
Q: B- For data mentioned below, find mean, median, variance, Range, standare deviation, First, second…
A: Data, in ascending order,1,2,3,5,7,8,9,11,13,14,15,16,17,18,19,20,21,22,24,25,26n=0
Q: 2. We are given data 124 ; 58 ; 215 ; 123 ; 79 ; 68 ; 82 ; 130 ; 128 ; 150 132 ; 69 ; 132 ; 115 ;…
A:
Q: Calculate the mean deviation and its coefficient from the following data : Class Frequency Class…
A: Given that data I want to find coefficients of mean deviation. Mean = sum of all…
Q: Calculate standard deviation from the following data. Marks Frequency | 6 0-10 10-20 20-30 30-40…
A: Class Interval Frequency, f Midpoint, x fx x2 fx2 0-10 6 5 30 25 150 10-20 8 15 120 225 1800…
Q: Illustration 10.7. Compute the standard deviation by the short method for the following data: 11,…
A: Data given 11,12,13,14,15,16,17,18,19,20,21
Q: The Table 1 shows a sample of college students was asked how much they spent monthly on a cell phone…
A:
Q: In my homework assignment, I have a concern about standard deviation do I have to round it to two…
A: Rounding-off must always be done as per the instruction in the question. In the absence of an…
Q: Can you assist me in answering this? (this is not graded but, rather, an excersice conducive to…
A:
Q: 2000 5 2001 2002 2003 4. 2004 2005 2006 2007 3 4. Find the mean, median, mode, standard deviation…
A:
Q: Q1/ The table below gives the number of accidents each year at a particular road junction : 2000…
A: “Since you have asked multiple questions, we will solve the first question for you. If you want any…
Q: For the data shown, answer the questions. Round to 2 decimal places. x 8 20.2 5.3 4.6 22.8 15.2…
A: The value of mean is, Thus, the value of mean is,14.15
Q: Given the population 10 top scores of Cricketer Saeed Anwer from February 1997 to June 2001 Table 2…
A: Use EXCEL Procedure for finding the value of population variance. Follow the instruction to obtain…
Q: A simple forecasting method for weekly sales of flash drives used by a localcomputer dealer is to…
A: The forecast error in t, et is the difference between forecast for demand in period t and actual…
Q: Calculate the mean deviation and its coefficient from the following data : Class Frequency Class…
A:
Q: this assignment, round all answers (when necessary) to exactly three decimal places. The numbers of…
A: From the given data we find the standard deviation.
Q: Calculate the standard deviation and variance of the data shown, to two decimal places X. 20.7 28.5…
A: The given data is: x 20.7 28.5 20.9 2.8 12.5 13.7 27.8 The mean for the data (μ)…
Q: Illustration 10.4. Compute the standard deviation for following data: 11. 12. 13. 14, 15, 16, 17,…
A:
Q: The ages (in years) of a random sample of shoppers at a gaming store are shown. Determine the range,…
A: We have to calculate some summary statistics for given data.
Q: 4. Figure 1 shows histograms for 3 different datasets. The summary statistics of the datasets are…
A: Introduction :- Summary statistics of three data sets are given. We have to match summary…
Q: Listed below are the amounts (dollars) it costs for marriage proposal packages at different baseball…
A:
Q: consider the data given and find standard deviation below Scores Comulative frequency o- 4 5-9 4 10…
A: Given data is scores cumulative frequency 0-4 1 5-9 4 10-14 12 15-19 21 20-24 30…
Q: 1) Dataset: 88 123 47 45 66 190 157 91 3) Assuming the dataset from Question #1 represents a sample,…
A: From the given information, number of observations is 8.The sample standard deviation formula is…
Q: Find the median and mean deviation of the following data; Frequency 7 12 15 25 Size 40-50 50-60…
A:
Q: At a fishery, the largest catches in August were of blackfin tuna, sailfish, blue marlin, and king…
A: Given Blackfin tuna SD=2.61 Sailfish SD=4.61 Blue marlin SD=1.97 King mackerel SD=6.67
Q: Listed below are the amounts (dollars) it costs for marriage proposal packages at different baseball…
A: listed below are the amounts (dollars) it costs for marriage Range = ? s.d =? variance = ?
Q: Find the mean and standard deviation for the individualized instruction scores. Scores…
A:
Q: The table below gives the number of accidents each year at a particular road junction: 2000 2001…
A: S.no. x (x-xbar)^2 1 2 6.890625 2 3 2.640625 3 4 0.390625 4 4 0.390625 5 5 0.140625 6 5…
Q: For this grouped data set: Scores | Frequencies 30-34 | 7 25-29 |…
A:
Q: Calculate Quartile Deviation and coefficient of Quartile Deviation from the following data : Age in…
A:
Q: Identify the histogram for the frequency distribution below. Data Frequency 2-6 3 7-11 12-16 6 17-21…
A: Draw Histogram Class Frequency 2 - 6 3 7 - 11 5 12 - 16 6 17 - 21 5 22 - 26 2
Q: 35 29 26 33 29 27 30 22 19 29 29 29 32 29 29 33 25 19 19 22 Find the Mean, Median, Mode, Midrange,…
A: We have given the data, first, we have to arrange the data in ascending order. 19 19 19 22 22…
Q: Given the population 10 top scores of Cricketer Saeed Anwer from February 1997 to June 2001 Table 2…
A:
Q: Typo Univeresitty attempts to predict the cumulative GPA of its students from the number of…
A:
Q: Grades 50-60 60-70 70-80 80-90 90-100 3 No. of Students 11 Calculate the standard deviation of the…
A:
Q: Illustration 3. Find out the value of quartile deviation and its cocfficient from the following data…
A: Solution, We have to find quartile Devitation Therefore, quartile Devitation = Q3-Q1/2 Q3=40 Q1=15…
Q: Given the fuel economy data shown in the frequency Distribution at the right, what are the…
A: Here, the first lower and upper case limits are 22 and 27. Then, the midpoint of the class is 24.5…
Q: Why does the graph on the right have a higher standard deviation? 1 2 3 4 5 6 7 1 2 3 4 5 6 7 What…
A: We'll answer the first question since the exact one wasn't specified. Please submit a new question.…
Q: The ages in years of a random sample of shoppers at a gaming store are shown. Determine the range,…
A:
Q: Answer all questions: 1. What is the range and standard deviation for the following population of…
A: According to the provided information, the scores are: 5,2,5,4
Q: For the data shown, answer the questions. Round to 2 decimal places. X 2.2 3.9 19.8 25.8 3 30 17.5…
A:
Q: Q2 – For the data in table (1): / 1- Draw the frequency distribution diagram. 2 - Find the class…
A: (1) Draw the frequency distribution diagram. The frequency distribution diagram is plotted below as…
Q: Find the mean, variance, and standard deviation for each set of data. 南計| 1. 3-8 1 8- 13 19 2 13 -…
A: We have to find the mean, variance, standard deviation.
Q: Question 3 The number of hours worked per week for a sample of ten students is shown below. Student…
A: 1. Mean: Mean is the expected value of a set of observations. In other words, mean is he average of…
Q: Calculate the sample standard deviation of the quantitative data shown. Round to two decimal plac- X…
A: Given data 11,14,27,15,10,28,26,27
Q: For the data from a sample shown below, answer the questions. Round to 2 decimal places. 10.4 3.6…
A: We have to find the mean, median and standard deviation.
Q: Q1 For the tabulated data, find the (a) mean, (b) median, (c) mode, (d) standard deviation. Classes…
A: The table helps to find the value mean, median, mode and standard deviation. classes Frequency,fi…
Q: 1 2 3 4 5 6 7 8 9 10 11 12 2 6,2 1, 5, 2,7 7,8,4 2,5 3,6 2 6 where 7 | 2 = 72 students Calculate the…
A: Solution-: We have get following data from the stem-and-leaf plot: xi:…
Q: Find the mean and standard deviation for the individualized instruction scores. Scores…
A: The table shows the frequency of individualized instruction.
Q: calculate the standard deviation for the data in the table Range Frequency 1-10 11-20 7. 21-30 10…
A: We have to find the standard deviation.


Trending now
This is a popular solution!

Step by step
Solved in 2 steps with 1 images
