Graph the following data on market and social demand and then answer two question Price Market Quantity Demanded Social Quantity Demanded (S) (units per month) (units per month) 20 10 20 18 20 30 16 30 40 14 40 50 12 50 60 10 60 70
Graph the following data on market and social demand and then answer two question Price Market Quantity Demanded Social Quantity Demanded (S) (units per month) (units per month) 20 10 20 18 20 30 16 30 40 14 40 50 12 50 60 10 60 70

Chapter6: Elasticity
Section: Chapter Questions
Problem 12QP

Related questions
Question
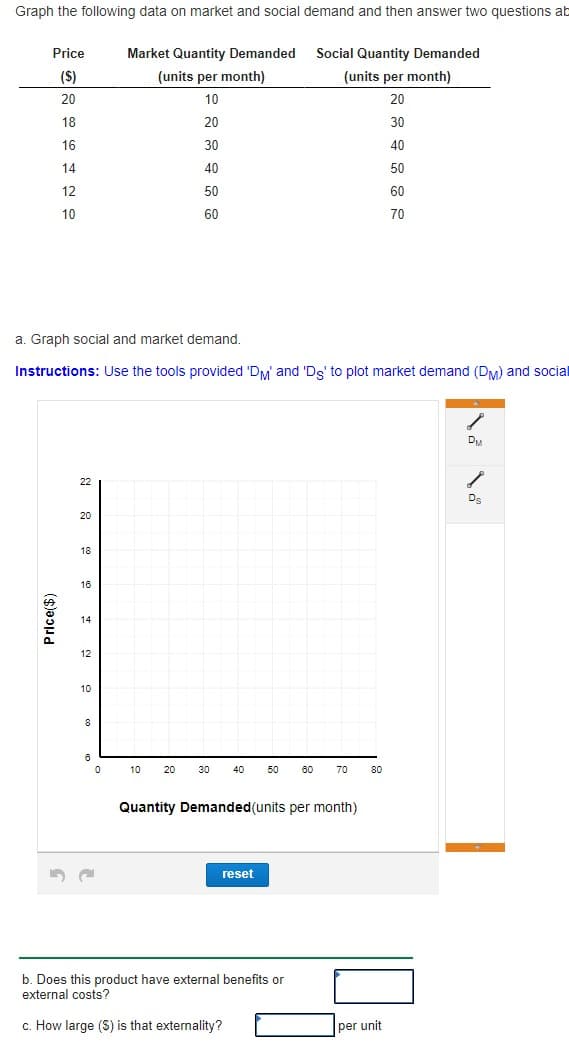
Transcribed Image Text:Graph the following data on market and social demand and then answer two questions ab
Price
Market Quantity Demanded
Social Quantity Demanded
($)
(units per month)
(units per month)
20
10
20
18
20
30
16
30
40
14
40
50
12
50
60
10
60
70
a. Graph social and market demand.
Instructions: Use the tools provided 'DM and 'Ds' to plot market demand (DM) and social
DM
22
Ds
20
18
16
14
12
10
10
20
30
40
50
60
70
80
Quantity Demanded(units per month)
reset
b. Does this product have external benefits or
external costs?
c. How large (S) is that externality?
per unit
Price($)
Expert Solution
This question has been solved!
Explore an expertly crafted, step-by-step solution for a thorough understanding of key concepts.

This is a popular solution!

Trending now
This is a popular solution!

Step by step
Solved in 2 steps with 2 images

Recommended textbooks for you

Economics (MindTap Course List)
Economics
ISBN:
9781337617383
Author:
Roger A. Arnold
Publisher:
Cengage Learning

Principles of Economics 2e
Economics
ISBN:
9781947172364
Author:
Steven A. Greenlaw; David Shapiro
Publisher:
OpenStax
Economics (MindTap Course List)
Economics
ISBN:
9781337617383
Author:
Roger A. Arnold
Publisher:
Cengage Learning
Principles of Economics 2e
Economics
ISBN:
9781947172364
Author:
Steven A. Greenlaw; David Shapiro
Publisher:
OpenStax

Brief Principles of Macroeconomics (MindTap Cours…
Economics
ISBN:
9781337091985
Author:
N. Gregory Mankiw
Publisher:
Cengage Learning

Essentials of Economics (MindTap Course List)
Economics
ISBN:
9781337091992
Author:
N. Gregory Mankiw
Publisher:
Cengage Learning

Exploring Economics
Economics
ISBN:
9781544336329
Author:
Robert L. Sexton
Publisher:
SAGE Publications, Inc