> A Moving to another question will save this response. uestion 25 AS2 AS, AS3 e2 e. P3 AD Q2 Q, Q3 Real Domestic Output Refer to the graph. If aggregate supply shifts from AS to AS2, what will happen to price level and real domestic output? 4 For the toolbar, press ALT+F10 (PC) or ALT+FN+F10 (Mac). 6 白Q っc 12pt A v B IUS Paragraph Open Sans,sa... v Price Level O----
> A Moving to another question will save this response. uestion 25 AS2 AS, AS3 e2 e. P3 AD Q2 Q, Q3 Real Domestic Output Refer to the graph. If aggregate supply shifts from AS to AS2, what will happen to price level and real domestic output? 4 For the toolbar, press ALT+F10 (PC) or ALT+FN+F10 (Mac). 6 白Q っc 12pt A v B IUS Paragraph Open Sans,sa... v Price Level O----

Chapter10: Bringing In The Supply Side: Unemployment And Inflation?
Section: Chapter Questions
Problem 1DQ

Related questions
Question
Transcribed Image Text:A Moving to another question will save this response.
Quèstion 25
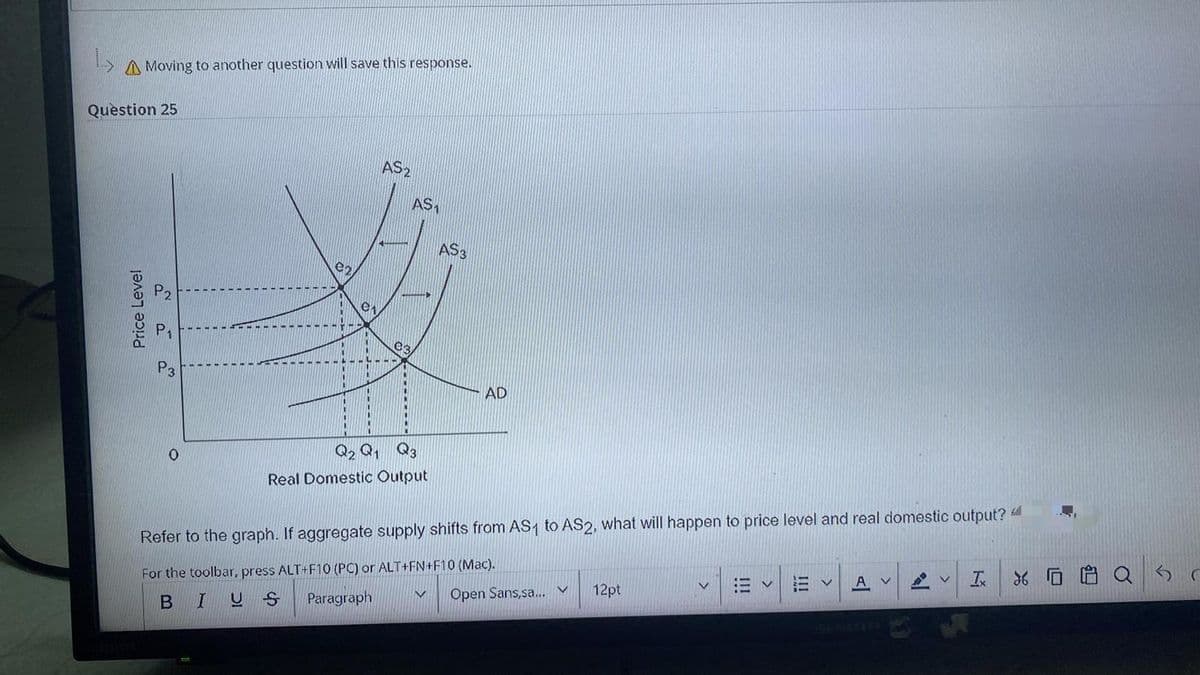
AS2
AS
AS3
e3
P3
AD
Q2 Q, Q3
Real Domestic Output
Refer to the graph. If aggregate supply shifts from AS1 to AS2, what will happen to price level and real domestic output? 4
For the toolbar, press ALT+F10 (PC) or ALT+FN+F10 (Mac).
Paragraph
ニv
A
12pt
Open Sans,sa... v
BIUS
Price Level
!!!
Expert Solution
This question has been solved!
Explore an expertly crafted, step-by-step solution for a thorough understanding of key concepts.

This is a popular solution!

Trending now
This is a popular solution!

Step by step
Solved in 2 steps

Knowledge Booster


Learn more about
Need a deep-dive on the concept behind this application? Look no further. Learn more about this topic, economics and related others by exploring similar questions and additional content below.Recommended textbooks for you

Exploring Economics
Economics
ISBN:
9781544336329
Author:
Robert L. Sexton
Publisher:
SAGE Publications, Inc

Principles of Economics 2e
Economics
ISBN:
9781947172364
Author:
Steven A. Greenlaw; David Shapiro
Publisher:
OpenStax
Exploring Economics
Economics
ISBN:
9781544336329
Author:
Robert L. Sexton
Publisher:
SAGE Publications, Inc
Principles of Economics 2e
Economics
ISBN:
9781947172364
Author:
Steven A. Greenlaw; David Shapiro
Publisher:
OpenStax