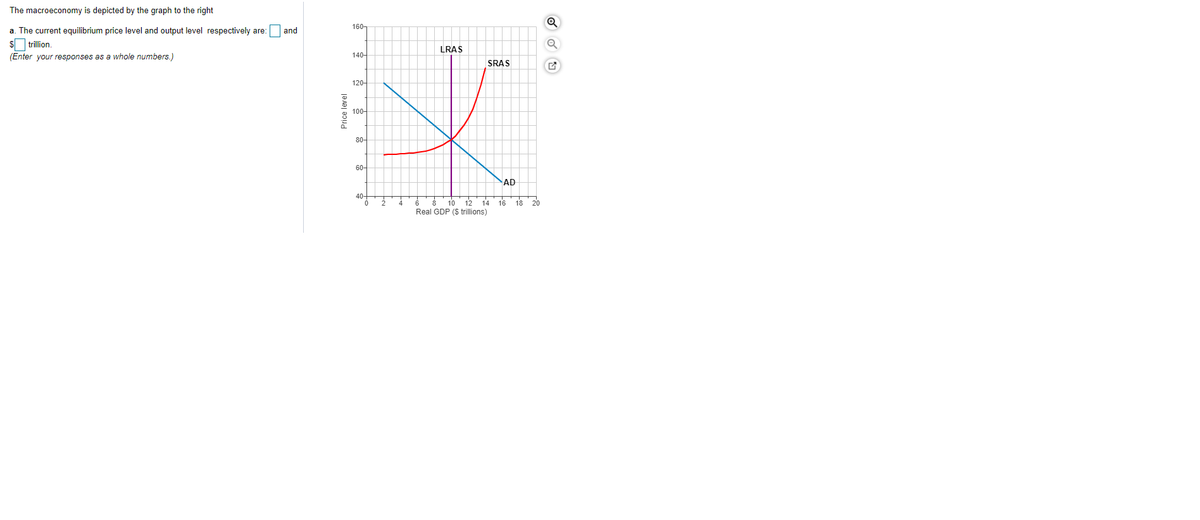
The macroeconomy is depicted by the graph to the right 160- a. The current equilibrium price level and output level respectively are:O and s trillion. LRAS (Enter your responses as a whole numbers 140- SRAS 120- 100 80- 60 NAD Real GDP ($ trillions)


Q: consider a simple Macroeconomic Model With the following equations: C=500 + 0.9 YD I=650 G=1000…
A: Given C = 500+0.9Yd I = 650 G = 1000 T = 0.3Y X = 700 IM = 0.23Y a) equilibrium national…
Q: e graph below shows the AD-AS diagram for Spain. All numbers are in billions. 100+ 000 AD 006 800…
A: In an economy, potential GDP is considered as the level of output that is estimated by the…
Q: Which of the following shocks has the biggest potential to increase a country's potential GDP? O A…
A: Gross domestic product (GDP) is the standard measure of the value added created through the…
Q: The below five graphs show the development of key macroeconomic variables over the scope of three…
A: Since you have asked multiple questions, we will solve the first question for you. If you want any…
Q: Economic Cycle Curves Construct the AD, SRAS, and LRAS curves for an economy experiencing (a) full…
A: LRAS =long run average supply, SRAS = short run average supply, AD = aggregate demand In short run…
Q: The following table contains nominal GDP and the GDP deflator from FRED" for the fourth quarter of…
A: Real GDP is the GDP which represent the inflation adjusted price of the goods and services , so here…
Q: n 1974, we had real GDP of 5,396.0, and in 1975 we had real GDP of 5,385.4. Further, in 1974, the…
A: Equilibrium real GDP and equilibrium price level occurs at the intersection point of aggregate…
Q: Using the AE-PC Model illustrate graphically the impact of each these factors in separate and…
A: Aggregate expenditure represents the total demand for all final goods and services in an economy at…
Q: With the AD-AS graph, what variable is on the vertical axes?
A: The AD( Aggregate Demand) and AS(AS) model is the one that represents the national income along with…
Q: E D Aggregate output Refer to Figure Which of the following causes the economy to move from Point A…
A: (D)
Q: Aggregate Supply LRAS 1. Draw LRAS (ONLY LRAS). What does LRAS 2. In your own words, explain what…
A: Since you have posted a question with multiple subparts, we will solve the first three subparts for…
Q: AS2 AS, AS3 e2 ) e, AD Real Domestic Output Refer to the graph. If aggregate supply shifts from AS1…
A: The macroeconomic equilbrium in an economy is determined by the aggregate demand and aggregate…
Q: AD-AS (aggregate demand/supply) Changes What things cause aggregate demand to shift? Why does each…
A: (a)In economics, AD can be stated as the aggregate/total demand of all the final services and goods…
Q: Which of the following shocks has the biggest potential to increase a country's potential GDP? O A…
A: Potential GDP refers to the level of output that an economy would produce if they are able to employ…
Q: Refer to the figure below. Price level (GDP deflator, 2002 = 100) LAS SAS 150 SASO 130 120 100 AD;…
A: In an economy, any change in market condition will have an impact on aggregate demand and aggregate…
Q: The movements in the production of motor vehicles and RVs Select one: O A. experience large…
A: Business cycle: The regular Ups and downs in the economic activities are known as the business…
Q: Suppose, initially the Australian economy is at full employment (in other words the economyis at the…
A: The full employment level reflects the long run output level, where the economy produce at its…
Q: Refer to the following graph to answer the next five questions. Price level (P) LRAS SRAS2 SRAS, AD2…
A: The short-run aggregate supply curve (SRAS) shows the direct relationship between aggregate output…
Q: The Great Recession was different from a typical recession since World War Il in that a) the rate of…
A: A recession is defined as the period of low or negative real GDP (output) growth with a large…
Q: Why must double counting be avoided when measuring GDP? Provide an elaborate answer with at least…
A: Hi, thank you for the question. As per our Honor code, we are allowed to attempt only the first…
Q: The table below shows information on aggregate supply, aggregate demand and the price level for the…
A: (a) The AD/AS figure is shown below. In the figure, the vertical axis measures price and horizontal…
Q: macroeconomic equilibrium is equal to potential GDP. Americans are becoming more cautious with their…
A: AD - AS Model The AD-AS model clarifies how changes in government strategies, variances in…
Q: Construct the AD, SRAS, and LRAS curves for an economy experiencing (a) full employment, (b) an…
A: The business cycle refers to the periodic expansion and contraction of the gross domestic product of…
Q: what are the theories of the cycle in economic gowth and fluactuations?
A: Keynesian Economist Keynes assumes that economic fluctuations occur in different periods of time of…
Q: Investment Demand $75 150 225 Investment ($) $50 100 150 Investment (5) AS AD, ($150) AD, ($100) AD,…
A: At the junction of the AS and the AD3, the economy is in a state of balance. The AD3 is equal to a…
Q: 1) How does the following transaction affect Canada’s GDP? Unless otherwise indicated, assume that…
A: James bond(resident of Canada) purchases a martini for 12 $ will increase the Canada GDP. The above…
Q: The GDP determination model has been modified, it now requires housecholds to pay a proportional tax…
A: GIVEN The GDP determination model has been modified, it now requires households to pay a…
Q: Suppose that in 2005, nominal wages decrease in Torania. Show how this event will change equilibrium…
A: The equilibrium output and price level are at a point where SRAS intersects with the AD curve. This…
Q: Suppose, initially the Australian economy is at full employment (in other words the economy is at…
A: The Australian economy is at full employment level, it means the aggregate demand (AD) and short-run…
Q: Suppose that the economy is depicted in the graph to the right. 160- a. The current equilibrium…
A: Equilibrium price level is 100.
Q: Suppose that in 2011, Quarterville’s government cuts taxes. Show how this event will change…
A: If tax is cut, supply curve shifts downwards and demand curve shifts higher upwards. Equilibrium…
Q: Required information AD Real Domestic Product, GDP er to the above graph. Which of the following…
A: The real balance effect or Pigou effect occurs during a period of deflation in the economy when…
Q: AD2 AD1 AD3 Real Domestic Product, GDP Refer to the graph. Which of the following changes will shift…
A: Answer: Explanation :- A cut/ decrease in personal and business taxes will increase the purchasing…
Q: The outbreak of COVID-19 adversely attacks most economies. Some economists argue that the impacts on…
A: Supply chain refers to the network between the producer and different kinds of sellers of the…
Q: What is macro economics describe briefly?
A: Economics: It is a branch of knowledge that is related to the production, consumption, and transfer…
Q: , which expenditure level will result in a recessionary ga
A: When the actual production in an economy is less than its potential production it is called as…
Q: “John Maynard Keynes introduced the AD-AS macroeconomic model (aggregate demand- aggregate supply)…
A: Aggregate demand curve shows the total value of the goods and services that are demanded at a…
Q: The graph below presents the Short Run Aggregate Supply Curve and the Aggregate Demand Curve for…
A: The intersecting point of aggregate supply curve and aggregate demand curve is the market…
Q: 6.1. What is an AD-AS model and what does such a model as per the given diagram essentially focus…
A: Since you have asked a multi-part question and according to the policy, we can only solve the first…
Q: Consider the graph below Suppose that the economy is at point A Price Level LRAS SRAS AD Y (GDP)…
A: Below is the edited graph:
Q: let's consider the AS/AD model. furthermore, assume two events happen at the same time: government…
A: The economies tend to operate through the economic and financial activities of various entities,…
Q: is depicted by the graph to the right orium price level and output level respectively are: 80 and S…
A: The AD-AS model shows what determines the total demand and total supply for the economy and how…
Q: AS AS, AS3 AD Real Domestic Output Refer to the graph. If aggregate supply shifts from AS1 to AS2,…
A: Here, one aggregate demand curve and three aggregate supply curves of an economy is given.
Q: Suppose concerns about the size of the federal budget deficit lead theU.S.Congress to cut all…
A: Federal budget deficit refers to that government expenditure is more than its revenue.
Q: In the AD/AS model assume 2019 began with potential real GDP = $19.7 trillion, while actual real GDP…
A: 2019:- Potential GDP: $19.7 trillion Actual Real GDP: $19 trillion Price level: 210 Later:- Actual…
Q: Construct the AD, SRAS, and LRAS curves for an economy experiencing (a) full employment, (b) an…
A: a. Below is the curve when there is full employment. The above curve represents the Real GDP on the…


Trending now
This is a popular solution!

Step by step
Solved in 2 steps


- How is long-term growth illustrated in an AD/AS model?Suppose the U.S. Congress passes significant immigration reform that makes it more difficult for foreigners to come to the United States to work. Use the AD/AS model to explain how this would affect the equilibrium level of GDP and the puce level.Without looking at Table 19.7, return to Figure 19.10. If we define a recession as a significant decline in national output, can you identify any post-1960 recessions in addition to the 20082009 recession? (This requires a judgment call.)
- Measuring Yt and Yt : A real-world problem faced by policymakers, forecasters, and businesses every day is how to judge the state of the economy. Consider the table below, showing hypothetical measures of real GDP in the coming years, starting at a level of $18.0 trillion in 2018. Now fill in the remaining columns of the table by answering the following questions. (a) What is potential output in 2018? You could call this a trick question, since there’s no way for you to know the answer! In a way, that’s the main point: fundamentally, we have to take some other measurements and make some assumptions. Suppose your research assistant tells you that in 2018, business surveys, unemployment reports, and recent years’ experience suggest that the economy is operating at potential output. So go ahead and write 18.0 for potential in this year. (b) Assume potential output grows at a constant annual rate of 2.5%, and complete the remainder of the table. (c) Comment on…What variable allows our macroeconomic model to automatically adjust GDP back to full employment level of output (i.e., LRAS or trend GDP)? Question 45 options: changes in the money supply changes in nominal wages changes in nominal interest rates changes in the CPIQuestion 1 a) Give the definition of GDP and explain what items are not included in its calculation? b) How is GDP calculated using the expenditure approach? c) How is GDP calculated using the income approach? d) Explain the problem of "double-counting" and how it can be avoided in calculating GDP Question 2 Assume that an economy is initially operating at the natural rate of output (full employment output). Use the AD-AS model to illustrate graphically the effects on price and output of an increase in government spending and a decrease in the cash rate. Explain your assumptions with respect to the range of aggregate supply of your analysis.
- With the AD-AS graph, what variable is on the vertical axes? a. National Income b. The price of the good we are studying c. The price of labor d. The price levelNeed help with macroeconomic review questions! 1) How does the following transaction affect Canada’s GDP? Unless otherwiseindicated, assume that each of the subsequently mentioned people resides in Canada. (j) James Bond purchases a martini, shaken not stirred, for $12, in Calgary. 2) Consider a country with no government and no international trade. The country’seconomy has fixed prices and interest rates. Let C = 300 and I = 150 + 0.75Y . Whatis this country’s GDP? Show your work. 3) Consider a country with no international trade. The country’s economy has fixedprices and interest rates. Let C = 300 + 0.2Y , I = 250, and G = 0.5C. What is thiscountry’s GDP?Malaysia GDP to rebound up to 7.5% in 2021, central bank predicts The Malaysian economy is expected to grow between 6% and 7.5% this year, the central bank said on Wednesday, with COVID-19 vaccinations and stronger external demand driving a recovery from the 5.6% contraction for 2020. Central bank Governor Nor Shamsiah Yunus said growth this year would also be underpinned by higher private and public expenditures, while an accelerating immunization campaign will improve confidence. "The Malaysian economy is projected to rebound in 2021, with the gross domestic product achieving pre-COVID-19 levels by mid-2021,". The new full-year estimate leaves slightly more room at the low end, compared with a previous forecast of 6.5% to 7.5% expansion. "In our forecast, we assume that herd immunity will only be achieved in the first quarter of 2022," Nor Shamsiah explained. She also said the bank considered that Malaysia's international borders could remain largely closed for the entire year, but…
- Economic On April 27, 2023, the U.S. Bureau of Economic Analysis (BEA) released the data on GDP growth for the US economy for the first quarter of 2023 and revealed that the economy grew sluggishly by only 1.1 percent. Based on this report, suppose the U.S. consumers and businesses start to become pessimistic about the direction of the economy and eventually cut consumer and business spending, analyze using the IS-LM and AD-AS frameworks the short and long-run effects of such a shock on prices, output, and real interest rate.Use two diagrams to explain the effects of the determinants of aggregatedemand on real GDP in a nation. ii. Suppose there is an expectation of a rapid general price increase in goodsand services in Australia in January 2021. Examine the effects of theanticipated general rapid increase in price for goods and services.The long run macroeconomic performance of an economy can be reflectedfrom the changes of her major macroeconomic indicators. With appropriateinterpretations of the changes to these indicators, one can identify the inherentstructural features of an economy, and hence, identify her strengths andweaknesses. In about 250 words, write a short essay on ONE economy from the list below:i. Singapore;ii. The United Kingdom;iii. The United States.In your essay, describe the changes of major macroeconomic indicators fromthe last decade. Using them to illustrate major structural features of the choseneconomy. Based on the above, identify ONE inherent problem implied bythese structural features that might limit her macroeconomic performance inthe long run. Suggest ONE practical government policy in dealing with thisinherent problem.