Problem 1) A statistical process control monitoring system samples the inside diameter of ball bearing every hour. Measurements were taken every hour for 25 hours. The target thickness, 7, is the average. 0.992 1.015 0.988 0.996 1.015 1.000 0.989 0.994 1.018 0.997 1.020 1.007 1.006 0.982 1.001 0.992 1.020 0.993 0.978 0.984 0.990 1.015 0.983 MANE
Problem 1) A statistical process control monitoring system samples the inside diameter of ball bearing every hour. Measurements were taken every hour for 25 hours. The target thickness, 7, is the average. 0.992 1.015 0.988 0.996 1.015 1.000 0.989 0.994 1.018 0.997 1.020 1.007 1.006 0.982 1.001 0.992 1.020 0.993 0.978 0.984 0.990 1.015 0.983 MANE

MATLAB: An Introduction with Applications
6th Edition
ISBN:9781119256830
Author:Amos Gilat
Publisher:Amos Gilat
Chapter1: Starting With Matlab
Section: Chapter Questions
Problem 1P

Related questions
Question
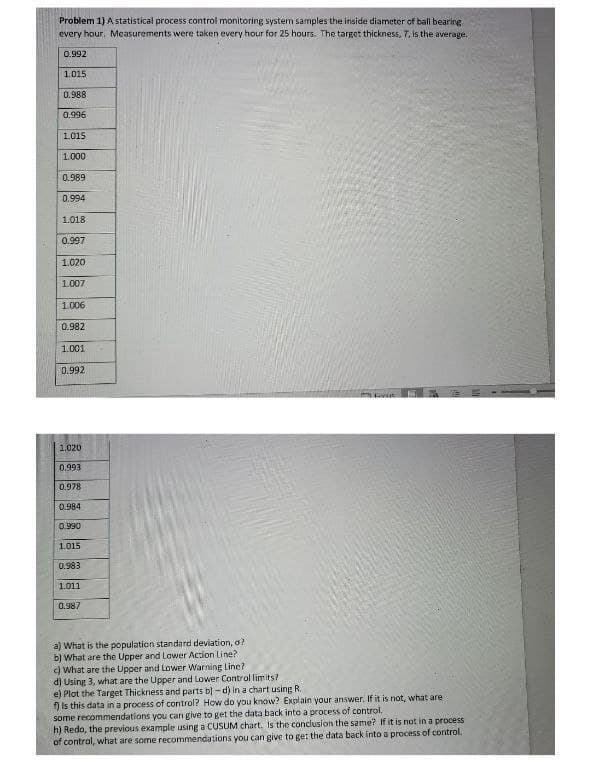
Transcribed Image Text:Problem 1) A statistical process control monitoring system samples the inside diameter of ball bearing
every hour. Measurements were taken every hour for 25 hours. The target thickness, 7, is the average.
0.992
1.015
0.988
0.996
1.015
1.000
0.989
0.994
1.018
0.997
1.020
1.007
1.006
0.982
1.001
0.992
1.020
0.993
0.978
0.984
0.990
1.015
0.983
1.011
0.987
a) What is the population standard deviation, o?
b) What are the Upper and Lower Action Line?
FIVER
c) What are the Upper and Lower Warning Line?
d) Using 3, what are the Upper and Lower Control limits?
e) Plot the Target Thickness and parts b)-d) in a chart using R.
f) Is this data in a process of control? How do you know? Explain your answer. If it is not, what are
some recommendations you can give to get the data back into a process of control.
h) Redo, the previous example using a CUSUM chart. Is the conclusion the same? If it is not in a process
of control, what are some recommendations you can give to get the data back into a process of control.
Expert Solution
This question has been solved!
Explore an expertly crafted, step-by-step solution for a thorough understanding of key concepts.

Step by step
Solved in 2 steps with 2 images

Recommended textbooks for you
MATLAB: An Introduction with Applications
Statistics
ISBN:
9781119256830
Author:
Amos Gilat
Publisher:
John Wiley & Sons Inc

Probability and Statistics for Engineering and th…
Statistics
ISBN:
9781305251809
Author:
Jay L. Devore
Publisher:
Cengage Learning

Statistics for The Behavioral Sciences (MindTap C…
Statistics
ISBN:
9781305504912
Author:
Frederick J Gravetter, Larry B. Wallnau
Publisher:
Cengage Learning
MATLAB: An Introduction with Applications
Statistics
ISBN:
9781119256830
Author:
Amos Gilat
Publisher:
John Wiley & Sons Inc
Probability and Statistics for Engineering and th…
Statistics
ISBN:
9781305251809
Author:
Jay L. Devore
Publisher:
Cengage Learning
Statistics for The Behavioral Sciences (MindTap C…
Statistics
ISBN:
9781305504912
Author:
Frederick J Gravetter, Larry B. Wallnau
Publisher:
Cengage Learning

Elementary Statistics: Picturing the World (7th E…
Statistics
ISBN:
9780134683416
Author:
Ron Larson, Betsy Farber
Publisher:
PEARSON

The Basic Practice of Statistics
Statistics
ISBN:
9781319042578
Author:
David S. Moore, William I. Notz, Michael A. Fligner
Publisher:
W. H. Freeman

Introduction to the Practice of Statistics
Statistics
ISBN:
9781319013387
Author:
David S. Moore, George P. McCabe, Bruce A. Craig
Publisher:
W. H. Freeman