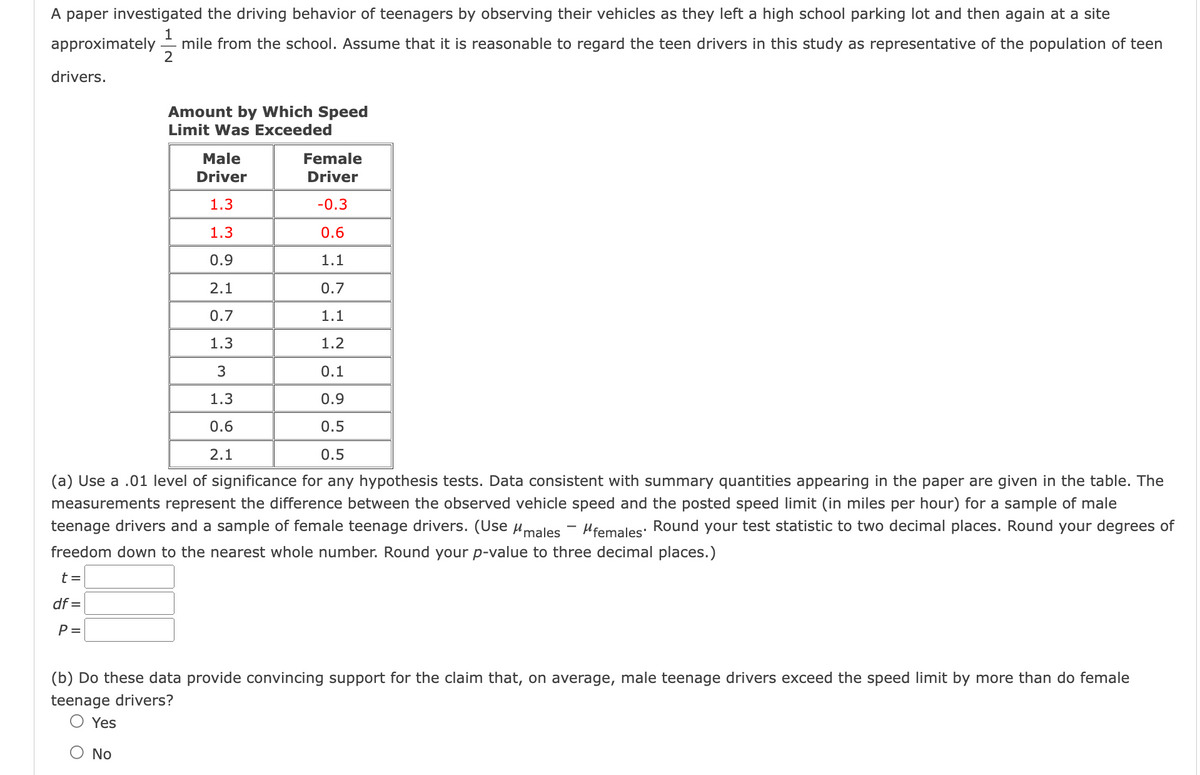
A paper investigated the driving behavior of teenagers by observing their vehicles as they left a high school parking lot and then again at a site approximately mile from the school. Assume that it is reasonable to regard the teen drivers in this study as representative of the population of teen 2 drivers. Amount by Which Speed Limit Was Exceeded Female Driver -0.3 0.6 1.1 0.7 1.1 1.2 0.1 0.9 0.5 0.5 (a) Use a .01 level of significance for any hypothesis tests. Data consistent with summary quantities appearing in the paper are given in the table. The measurements represent the difference between the observed vehicle speed and the posted speed limit (in miles per hour) for a sample of male teenage drivers and a sample of female teenage drivers. (Use #males #females. Round your test statistic to two decimal places. Round your degrees of freedom down to the nearest whole number. Round your p-value to three decimal places.) t= df= P= Male Driver 1.3 1.3 0.9 2.1 0.7 1.3 3 1.3 0.6 2.1 (b) Do these data provide convincing support for the claim that, on average, male teenage drivers exceed the speed limit by more than do female teenage drivers? O Yes O No
A paper investigated the driving behavior of teenagers by observing their vehicles as they left a high school parking lot and then again at a site approximately mile from the school. Assume that it is reasonable to regard the teen drivers in this study as representative of the population of teen 2 drivers. Amount by Which Speed Limit Was Exceeded Female Driver -0.3 0.6 1.1 0.7 1.1 1.2 0.1 0.9 0.5 0.5 (a) Use a .01 level of significance for any hypothesis tests. Data consistent with summary quantities appearing in the paper are given in the table. The measurements represent the difference between the observed vehicle speed and the posted speed limit (in miles per hour) for a sample of male teenage drivers and a sample of female teenage drivers. (Use #males #females. Round your test statistic to two decimal places. Round your degrees of freedom down to the nearest whole number. Round your p-value to three decimal places.) t= df= P= Male Driver 1.3 1.3 0.9 2.1 0.7 1.3 3 1.3 0.6 2.1 (b) Do these data provide convincing support for the claim that, on average, male teenage drivers exceed the speed limit by more than do female teenage drivers? O Yes O No

MATLAB: An Introduction with Applications
6th Edition
ISBN:9781119256830
Author:Amos Gilat
Publisher:Amos Gilat
Chapter1: Starting With Matlab
Section: Chapter Questions
Problem 1P

Related questions
Question
Transcribed Image Text:A paper investigated the driving behavior of teenagers by observing their vehicles as they left a high school parking lot and then again at a site
1
approximately mile from the school. Assume that it is reasonable to regard the teen drivers in this study as representative of the population of teen
2
drivers.
Female
Driver
-0.3
0.6
1.1
0.7
1.1
1.2
0.1
0.9
0.5
0.5
(a) Use a .01 level of significance for any hypothesis tests. Data consistent with summary quantities appearing in the paper are given in the table. The
measurements represent the difference between the observed vehicle speed and the posted speed limit (in miles per hour) for a sample of male
teenage drivers and a sample of female teenage drivers. (Use males Mfemales
Round your test statistic to two decimal places. Round your degrees of
freedom down to the nearest whole number. Round your p-value to three decimal places.)
t =
df =
P=
Amount by Which Speed
Limit Was Exceeded
Yes
(b) Do these data provide convincing support for the claim that, on average, male teenage drivers exceed the speed limit by more than do female
teenage drivers?
Ο No
Male
Driver
1.3
1.3
0.9
2.1
0.7
1.3
3
1.3
0.6
2.1
Expert Solution
This question has been solved!
Explore an expertly crafted, step-by-step solution for a thorough understanding of key concepts.

Step by step
Solved in 4 steps

Recommended textbooks for you
MATLAB: An Introduction with Applications
Statistics
ISBN:
9781119256830
Author:
Amos Gilat
Publisher:
John Wiley & Sons Inc

Probability and Statistics for Engineering and th…
Statistics
ISBN:
9781305251809
Author:
Jay L. Devore
Publisher:
Cengage Learning

Statistics for The Behavioral Sciences (MindTap C…
Statistics
ISBN:
9781305504912
Author:
Frederick J Gravetter, Larry B. Wallnau
Publisher:
Cengage Learning
MATLAB: An Introduction with Applications
Statistics
ISBN:
9781119256830
Author:
Amos Gilat
Publisher:
John Wiley & Sons Inc
Probability and Statistics for Engineering and th…
Statistics
ISBN:
9781305251809
Author:
Jay L. Devore
Publisher:
Cengage Learning
Statistics for The Behavioral Sciences (MindTap C…
Statistics
ISBN:
9781305504912
Author:
Frederick J Gravetter, Larry B. Wallnau
Publisher:
Cengage Learning

Elementary Statistics: Picturing the World (7th E…
Statistics
ISBN:
9780134683416
Author:
Ron Larson, Betsy Farber
Publisher:
PEARSON

The Basic Practice of Statistics
Statistics
ISBN:
9781319042578
Author:
David S. Moore, William I. Notz, Michael A. Fligner
Publisher:
W. H. Freeman

Introduction to the Practice of Statistics
Statistics
ISBN:
9781319013387
Author:
David S. Moore, George P. McCabe, Bruce A. Craig
Publisher:
W. H. Freeman