he data is the 50 highest grossing films (as of 2021). Box office totals are measured in billions of dollars. Create a scatterplot with the explanatory variable being the Year and response the Revenue (in billions). Make sure to make a copy of the scatterplot in the word document. Find the equation of the least square’s regression line. Interpret the correlation coefficient, and coefficient of determination (one sentence each).
he data is the 50 highest grossing films (as of 2021). Box office totals are measured in billions of dollars. Create a scatterplot with the explanatory variable being the Year and response the Revenue (in billions). Make sure to make a copy of the scatterplot in the word document. Find the equation of the least square’s regression line. Interpret the correlation coefficient, and coefficient of determination (one sentence each).

MATLAB: An Introduction with Applications
6th Edition
ISBN:9781119256830
Author:Amos Gilat
Publisher:Amos Gilat
Chapter1: Starting With Matlab
Section: Chapter Questions
Problem 1P

Related questions
Question
The data is the 50 highest grossing films (as of 2021). Box office totals are measured in billions of dollars.
- Create a
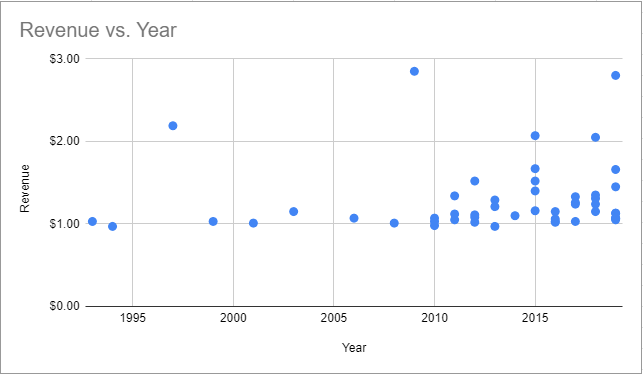
scatterplot with the explanatory variable being the Year and response the Revenue (in billions). Make sure to make a copy of the scatterplot in the word document. - Find the equation of the least square’s regression line.
- Interpret the
correlation coefficient , and coefficient of determination (one sentence each). - Is year a good predictor of box office revenue? Give a 1-2 sentence reason why you think so (or not).
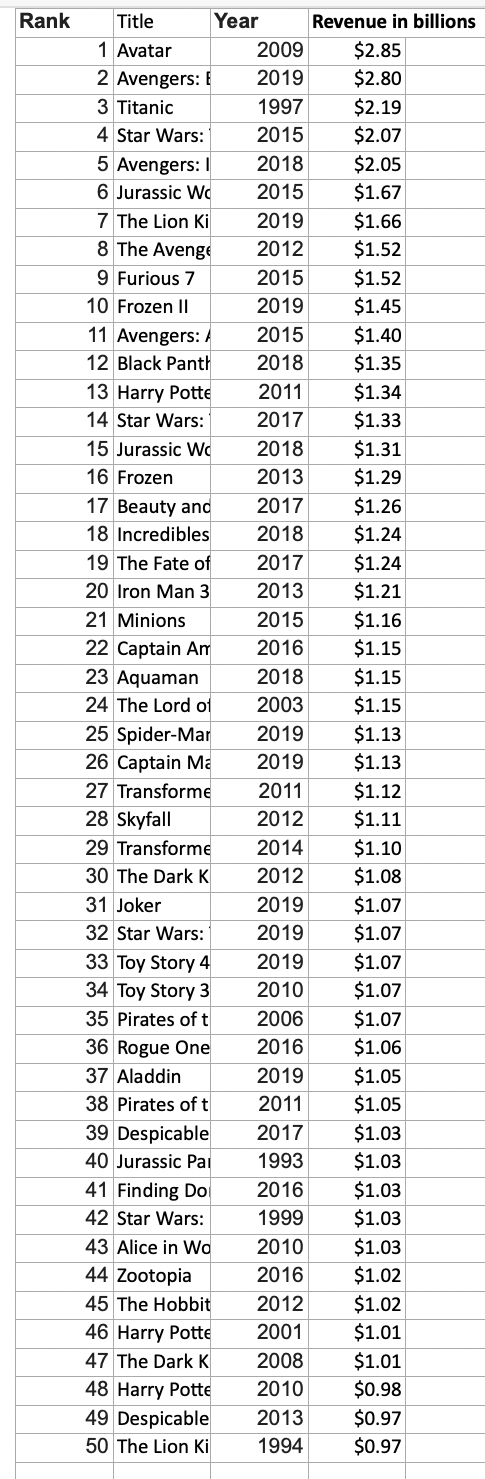
Transcribed Image Text:Rank
Title
Year
Revenue in billions
1 Avatar
2009
$2.85
2 Avengers: E
2019
$2.80
3 Titanic
1997
$2.19
4 Star Wars:
2015
$2.07
5 Avengers:
$2.05
$1.67
2018
6 Jurassic Wc
2015
7 The Lion Ki
2019
$1.66
8 The Avenge
2012
$1.52
9 Furious 7
$1.52
$1.45
2015
10 Frozen II
2019
11 Avengers: /
12 Black Panth
$1.40
$1.35
2015
2018
$1.34
$1.33
13 Harry Potte
2011
14 Star Wars:
2017
15 Jurassic Wo
2018
$1.31
16 Frozen
2013
$1.29
17 Beauty and
$1.26
$1.24
2017
18 Incredibles
2018
19 The Fate of
2017
$1.24
20 Iron Man 3
2013
$1.21
21 Minions
2015
$1.16
$1.15
22 Captain Am
2016
23 Aquaman
2018
$1.15
24 The Lord of
2003
$1.15
25 Spider-Mar
26 Captain Ma
2019
$1.13
2019
$1.13
27 Transforme
2011
$1.12
28 Skyfall
2012
$1.11
$1.10
$1.08
29 Transforme
2014
30 The Dark K
2012
$1.07
$1.07
31 Joker
2019
32 Star Wars:
2019
33 Toy Story 4
34 Toy Story 3
$1.07
$1.07
2019
2010
$1.07
$1.06
35 Pirates oft
2006
36 Rogue One
37 Aladdin
2016
$1.05
$1.05
2019
38 Pirates oft
2011
39 Despicable
$1.03
$1.03
2017
40 Jurassic Pai
1993
41 Finding Do
$1.03
$1.03
2016
42 Star Wars:
1999
2010
$1.03
$1.02
43 Alice in Wo
44 Zootopia
2016
45 The Hobbit
2012
$1.02
46 Harry Potte
2001
$1.01
47 The Dark K
2008
$1.01
48 Harry Potte
49 Despicable
50 The Lion Ki
2010
$0.98
2013
$0.97
1994
$0.97
Expert Solution
Step 1
Given Information:
The data represents 50 highest grossing films and the Box office totals are measured in billions of dollars.
The independent variable (X) is the 'Year' and the response variable (Y) is 'Revenue'.
1) To create a scatterplot for the data.
A scatterplot is a graphical representation that indicates the relationship between two variables.
Construct scatterplot using Excel. Steps to follow are given below:
- Highlight the required data i.e., column 'Year' and 'Revenue'.
- Go to Insert, under different chart options, select Scatterplot.
Excel output is given below:

Trending now
This is a popular solution!

Step by step
Solved in 3 steps with 1 images

Recommended textbooks for you
MATLAB: An Introduction with Applications
Statistics
ISBN:
9781119256830
Author:
Amos Gilat
Publisher:
John Wiley & Sons Inc

Probability and Statistics for Engineering and th…
Statistics
ISBN:
9781305251809
Author:
Jay L. Devore
Publisher:
Cengage Learning

Statistics for The Behavioral Sciences (MindTap C…
Statistics
ISBN:
9781305504912
Author:
Frederick J Gravetter, Larry B. Wallnau
Publisher:
Cengage Learning
MATLAB: An Introduction with Applications
Statistics
ISBN:
9781119256830
Author:
Amos Gilat
Publisher:
John Wiley & Sons Inc
Probability and Statistics for Engineering and th…
Statistics
ISBN:
9781305251809
Author:
Jay L. Devore
Publisher:
Cengage Learning
Statistics for The Behavioral Sciences (MindTap C…
Statistics
ISBN:
9781305504912
Author:
Frederick J Gravetter, Larry B. Wallnau
Publisher:
Cengage Learning

Elementary Statistics: Picturing the World (7th E…
Statistics
ISBN:
9780134683416
Author:
Ron Larson, Betsy Farber
Publisher:
PEARSON

The Basic Practice of Statistics
Statistics
ISBN:
9781319042578
Author:
David S. Moore, William I. Notz, Michael A. Fligner
Publisher:
W. H. Freeman

Introduction to the Practice of Statistics
Statistics
ISBN:
9781319013387
Author:
David S. Moore, George P. McCabe, Bruce A. Craig
Publisher:
W. H. Freeman