he following data was collected from a clinical trial testing a new drug aimed to lower blood pressure for individuals older than age 45. Half of the 20 participants received the new drug (Treatment = Yes) and the other half of the participants received a placebo pill (Treatment = No). Their age and gender was also recorded.  Based on the data above. Researchers were interested in examining if there was a significant difference in blood pressure before and after the treatment for only the ten participants who got the new drug (Treatment = Yes). Compute the mean and standard deviation for the sample of difference scores f

Glencoe Algebra 1, Student Edition, 9780079039897, 0079039898, 2018
18th Edition
ISBN:9780079039897
Author:Carter
Publisher:Carter
Chapter0: Preparing For Algebra
Section: Chapter Questions
Problem 55PRT
icon
Related questions
Topic Video
Question

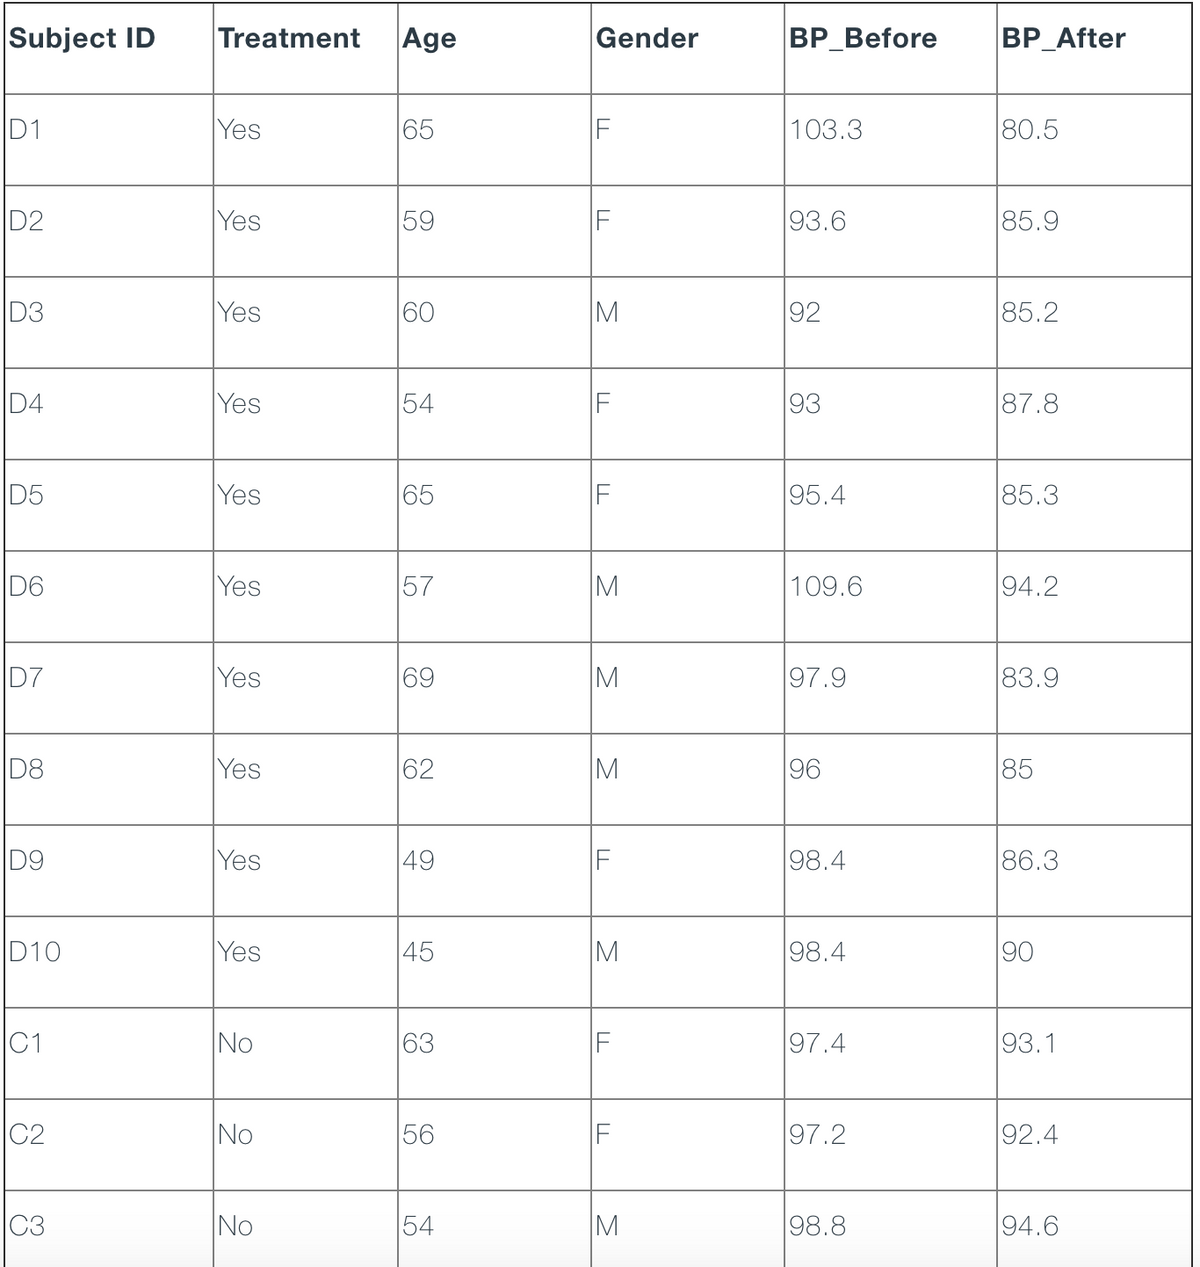
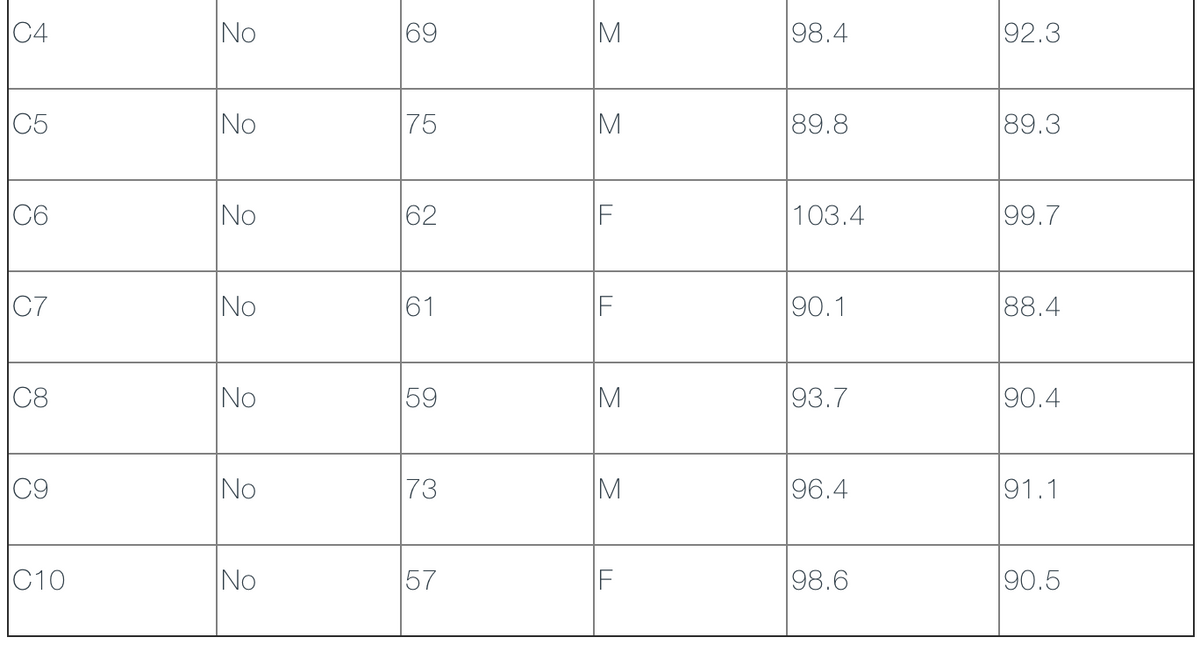
The following data was collected from a clinical trial testing a new drug aimed to lower blood pressure for individuals older than age 45. Half of the 20 participants received the new drug (Treatment = Yes) and the other half of the participants received a placebo pill (Treatment = No). Their age and gender was also recorded. 

Based on the data above. Researchers were interested in examining if there was a significant difference in blood pressure before and after the treatment for only the ten participants who got the new drug (Treatment = Yes).

Compute the mean and standard deviation for the sample of difference scores for those who received the new drug (Treatment = Yes). Round to two decimal points.

Mean=? SD=?

Subject ID
Treatment
Age
Gender
ВP Before
BP_After
D1
Yes
65
F
103.3
80.5
D2
Yes
59
93.6
85.9
D3
Yes
60
M
92
85.2
D4
Yes
54
93
87.8
D5
Yes
65
95.4
85.3
D6
Yes
57
109.6
94.2
D7
Yes
69
M
97.9
83.9
Yes
62
M
96
85
D9
Yes
49
98.4
86.3
D10
Yes
45
M
98.4
90
C1
No
63
97.4
93.1
C2
No
56
97.2
92.4
C3
No
54
M
98.8
94.6
Transcribed Image Text:Subject ID Treatment Age Gender ВP Before BP_After D1 Yes 65 F 103.3 80.5 D2 Yes 59 93.6 85.9 D3 Yes 60 M 92 85.2 D4 Yes 54 93 87.8 D5 Yes 65 95.4 85.3 D6 Yes 57 109.6 94.2 D7 Yes 69 M 97.9 83.9 Yes 62 M 96 85 D9 Yes 49 98.4 86.3 D10 Yes 45 M 98.4 90 C1 No 63 97.4 93.1 C2 No 56 97.2 92.4 C3 No 54 M 98.8 94.6
C4
No
69
98.4
92.3
C5
No
75
89.8
89.3
C6
No
62
103.4
99.7
C7
No
61
90.1
88.4
C8
No
59
93.7
90.4
No
73
96.4
91.1
C10
No
57
F
98.6
90.5
Transcribed Image Text:C4 No 69 98.4 92.3 C5 No 75 89.8 89.3 C6 No 62 103.4 99.7 C7 No 61 90.1 88.4 C8 No 59 93.7 90.4 No 73 96.4 91.1 C10 No 57 F 98.6 90.5
Expert Solution
trending now

Trending now

This is a popular solution!

steps

Step by step

Solved in 2 steps

Blurred answer
Knowledge Booster
Hypothesis Tests and Confidence Intervals for Proportions
Learn more about
Need a deep-dive on the concept behind this application? Look no further. Learn more about this topic, statistics and related others by exploring similar questions and additional content below.
Similar questions
  • SEE MORE QUESTIONS
Recommended textbooks for you
Glencoe Algebra 1, Student Edition, 9780079039897…
Algebra
ISBN:
9780079039897
Author:
Carter
Publisher:
McGraw Hill