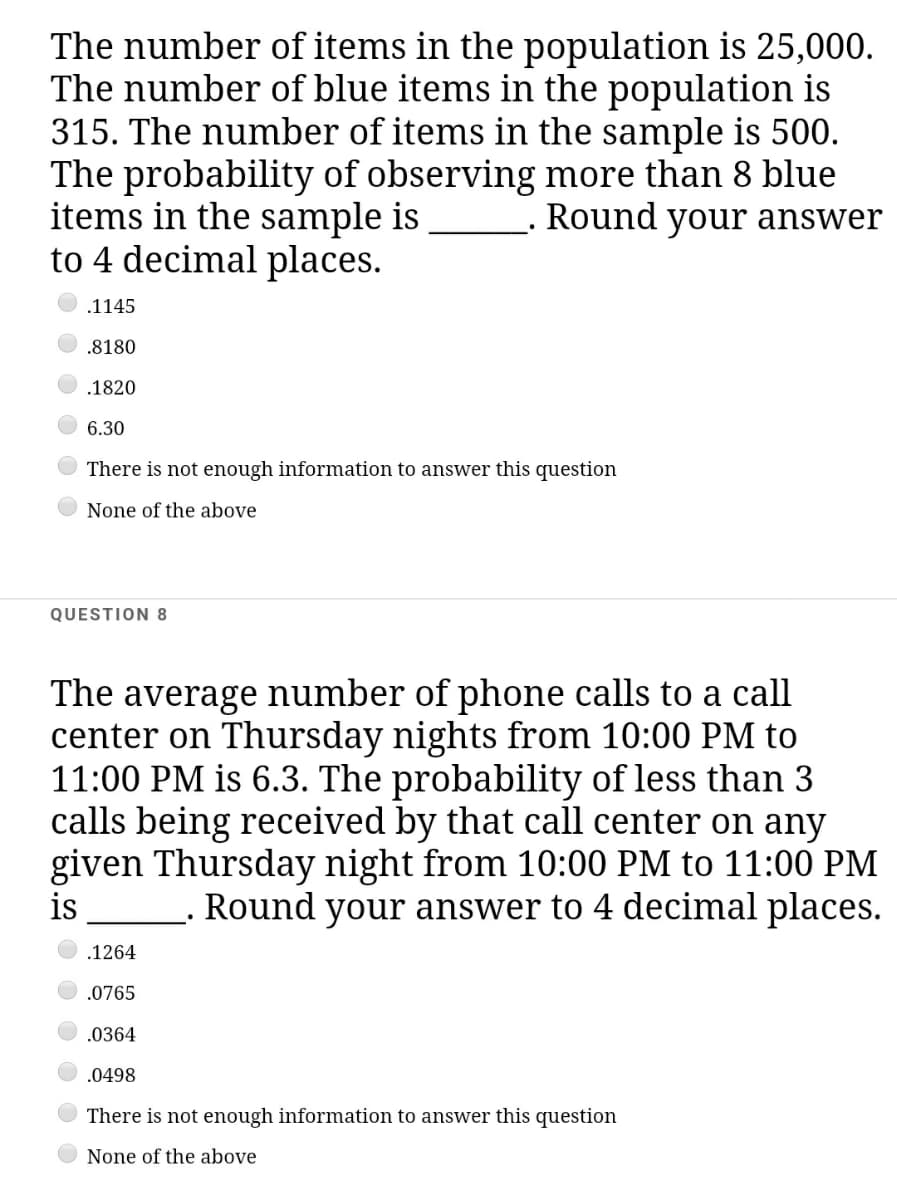
he number of items in the sa robability of observing more in the sample is Rour


Q: Given the tabulated data shown, prepare the Bar or GANTT Chart
A: Below is the solution;-
Q: -charts controls the dispersion of the process Group of answer choices True False Using 3…
A: R-charts controls the dispersion of the process Answer - true The R Chart is used for Process…
Q: BAQARAH Milk is fresh cow’s milk from Bangladesh’s first industrial hi-tech dairy farm which is…
A: BAQARAH Milk serves in Bangladesh by providing fresh and untouched milk to the citizens there. They…
Q: Elton Mayo is best associated with the Hawthorne studies which were conducted at t Hawthorn plant of…
A: The studies initially observed whether employees were more approachable and functioned more…
Q: It is a method of control in limited areas where engineering control methods at the source are not…
A: Adjusting work schedules is the method that involves changing an employee’s work schedule in order…
Q: a. Complete the ANOVA table. (Round the MS- and F-values to 4 decimal places.) SOURCE DF SS…
A: Here to determine the MS and F-values by formulae: MS = SSdfF = MS regMS err
Q: A company is in the business of making souvenir spoons to customer order. The customers select the…
A: The company's mission is to design the spoon whose size and emboss is selected by the customers. The…
Q: A pallet manufacturer has measured the output of a board cutting operation. Theboards have a…
A: Given Information: Lower Specification Limit (LSL) = 24 - 0.5 = 23.5 inch Upper Specification Limit…
Q: CATALFEN Company CATALFEN is located in Barcelona. They design and manufacture high-tech LED…
A: Note: Since the second component of the question asks for a personal opinion, it is subjective. As…
Q: Plastomer, Inc., specializes in the manufacture of high-gradeplastic film used to wrap food…
A: Pareto Chart or Pareto Principle, also known as 80/20 rule is a statistical tool which depicts that…
Q: An analyst made 30 observations over 15 minutes during which 12 units where produced. For 9…
A: Given: No of observation=30 Time required=15min Items produced=12 units For 9 observations the…
Q: Analysis of the output of a process has suggested that the variability is nonrandom on several…
A: Variations are present in output of a process, no two outputs can be exactly identical. But these…
Q: What is meaning of quality based on facts
A: Quality could be characterized as a fundamental instrument for a characteristic property of any…
Q: Sampling Site - Sampling Month - Clarity level - Conductivity - Resistivity - Phosphate…
A: Qualitative and Quantitative method: Qualitative method is subjective. It is also called primary…
Q: can be very useful in developing pareto chart a. Cause and effect diagram O b. Flow chart O c. Check…
A: The answer is as follows:
Q: Figure 3: sample size = 10000 0.9 0.8 lacf Opacf 0.7 0.6 0.5 0.4 0.3 acf and pact
A: OPTION b - An AR (2)
Q: Henson Automotive wants to understand how much water the company is using when manufacturing its…
A: Water is a vital resource available on earth. It is very difficult to imagine life without water. It…
Q: Houston North Hospital is trying to improve itsimage by providing a positive experience for its…
A: Day No. of Unsatisfied Patients Sample Size 1 24 100 2 22 100 3 8 100 4 15 100 5 10 100…
Q: Kindly write example and explain how they are used: 5. FISHBONE CHART 6. STATISTICAL PROCESS CHART
A: There are many types of diagrams and charts which are used by an organization to find out the…
Q: As part of an insurance company’s training program, participants learn how to conduct an analysis of…
A: USL = 45 minutes LSL =30 minutes Armand: Mean repair time (x) = 38 minutes Standard deviation (SD) =…
Q: (a) What is the value of X double bar (X bar bar )? Show calculation and final answer together.…
A: In The question, given that average of 9 boxes for each hour, The value of X double bar could be…
Q: 20. A teller at a drive-up window at a bank had the following service times (in minutes) for 20…
A: Given table 1 2 3 4 4.5 4.6 4.5 4.7 4.2 4.5 4.6 4.6 4.2 4.4 4.4 4.8 4.3 4.7 4.4 4.5 4.3…
Q: IV. The following data represent the number of dishes that are broken at a restaurant while loading…
A: Formula:
Q: The importance of pareto chart in business or hospitality industr
A: The importance of the Pareto chart in the hospitality industry is to analyze the following:…
Q: The accounts receivable department at Rick WingManufacturing has been having difficulty getting…
A: A) given that 10 samples of 50 bills each were taken over a month’s time.
Q: For a particular process, the mean value, Xbar, is 1.011 and the mean range value, Rbar, is 0.102.…
A: THE ANSWER IS AS BELOW:
Q: Compute CL, UCL, and LCL of MR and X Control Charts for the following data. Batch Number…
A:
Q: Analyze the Canadian company “Lululemon Athletica” using Porter’s Five Forces. Rate each of the…
A: Ans. Lululemon Athletica Inc. is a sports activities then athletics garments enterprise up to…
Q: Please create a PESTLE analysis of the fashion company H&M.
A: PESTLE Analysis of H&M examinations the brand on its business strategies. H&M PESTLE…
Q: Sample Mean Range 1......... 3.06 .42 2.... 3.15 .50 3......... 3.11 .41 4......... 3.13 .46…
A: The X bar and R chart helps in determining whether the process is stable or not. The X bar chart…
Q: Compute the following using customer satisfaction data from the table below. 2.1 Mean Squared Error…
A: The Mean Squared Error (M.S.E.) is a metric that indicates how near a fitted line is to the data…
Q: One of the purposes of using a fishbone diagram is to: Select one: O A. Define the problem in…
A: Fish bone diagram - It can also be said as Ishikawa diagram. It is usually a diagram which is…
Q: 5. An entrepreneur orders t-shirts and wants to ensure that they were printe properly. She randomly…
A: 5. Simple random sampling: Under simple random sampling, the sample is selected randomly from the…
Q: SSS's Experiment: Choosing an Appropriate Research Design Soft Space Solutions (SSS) is a software…
A: The reason for experimental research is to decide the connection between two factors (reliant and…
Q: is also known as PDSA cycle a. Ishikawa tool O b. Control chart C. Pareto analysis O d. Deming cycle…
A: The answer is as follows:
Q: design specifications that a key dimension on a product measure 101+16 units. A process being…
A: a)Process capability index:
Q: Describe a situation where it would be useful to use data validation in a table.
A: Data validation is a feature in Excel used to control what a user can enter into a cell. Data…
Q: Consider the following given below: Week Sales('000) 1 39 44 3 40 4 45 38 43 39 What is the Mean…
A: Forecasting is the process of estimating the future demand based on previous or historic data and…
Q: Identify the statement below that should not be part of a multiple-item summated Likert scale…
A: Likert scales are notable in demeanor estimation, where they are utilized to request subjects to…
Q: Bottles for room spr take six boxes of five samples are 15.43, 1 samples are 1.63,0. (R bar)
A: Explanation: Grand mean = average of all the means = (sum total of means)/(number of samples) =…
Q: What are the typical characteristics of a Restaurant meal with using several dimensions of q
A: Providing services is one of the most complicated & risky. Providing Restaurant Meal(service) is…
Q: Sanjeevini is a 100 bed hospital established 10 years ago and is performing well. Now the hospital…
A: As a rule, certain features of a clinical office's working stay unaddressed because of an uncommon…
Q: Measures of the balanced scorecard’s customer perspective include: a. Market share b. Number of…
A: The main mission of the balanced scorecard from the customer's perspective is to provide on-time…
Q: 3. The Colonial House Furniture Company manufactures two- drawer oak file cabinets that are sold…
A: Product yield can be characterized as the measure of product staying in the wake of handling.…
Q: Is this process capable
A: Process capability indicating whether a process capable to produce under the condition of specified…


Trending now
This is a popular solution!

Step by step
Solved in 2 steps with 1 images


- Use Excels functions (not @RISK) to generate 1000 random numbers from a normal distribution with mean 100 and standard deviation 10. Then freeze these random numbers. a. Calculate the mean and standard deviation of these random numbers. Are they approximately what you would expect? b. What fraction of these random numbers are within k standard deviations of the mean? Answer for k = 1; for k = 2; for k = 3. Are the answers close to what they should be (about 68% for k = 1, about 95% for k = 2, and over 99% for k = 3)? c. Create a histogram of the random numbers using about 10 bins of your choice. Does this histogram have approximately the shape you would expect?Based on Babich (1992). Suppose that each week each of 300 families buys a gallon of orange juice from company A, B, or C. Let pA denote the probability that a gallon produced by company A is of unsatisfactory quality, and define pB and pC similarly for companies B and C. If the last gallon of juice purchased by a family is satisfactory, the next week they will purchase a gallon of juice from the same company. If the last gallon of juice purchased by a family is not satisfactory, the family will purchase a gallon from a competitor. Consider a week in which A families have purchased juice A, B families have purchased juice B, and C families have purchased juice C. Assume that families that switch brands during a period are allocated to the remaining brands in a manner that is proportional to the current market shares of the other brands. For example, if a customer switches from brand A, there is probability B/(B + C) that he will switch to brand B and probability C/(B + C) that he will switch to brand C. Suppose that the market is currently divided equally: 10,000 families for each of the three brands. a. After a year, what will the market share for each firm be? Assume pA = 0.10, pB = 0.15, and pC = 0.20. (Hint: You will need to use the RISKBINOMLAL function to see how many people switch from A and then use the RISKBENOMIAL function again to see how many switch from A to B and from A to C. However, if your model requires more RISKBINOMIAL functions than the number allowed in the academic version of @RISK, remember that you can instead use the BENOM.INV (or the old CRITBENOM) function to generate binomially distributed random numbers. This takes the form =BINOM.INV (ntrials, psuccess, RAND()).) b. Suppose a 1% increase in market share is worth 10,000 per week to company A. Company A believes that for a cost of 1 million per year it can cut the percentage of unsatisfactory juice cartons in half. Is this worthwhile? (Use the same values of pA, pB, and pC as in part a.)Use @RISK to draw a binomial distribution that results from 50 trials with probability of success 0.3 on each trial, and use it to answer the following questions. a. What are the mean and standard deviation of this distribution? b. You have to be more careful in interpreting @RISK probabilities with a discrete distribution such as this binomial. For example, if you move the left slider to 11, you find a probability of 0.139 to the left of it. But is this the probability of less than 11 or less than or equal to 11? One way to check is to use Excels BINOM.DIST function. Use this function to interpret the 0.139 value from @RISK. c. Using part b to guide you, use @RISK to find the probability that a random number from this distribution will be greater than 17. Check your answer by using the BINOM.DIST function appropriately in Excel.
- Play Things is developing a new Lady Gaga doll. The company has made the following assumptions: The doll will sell for a random number of years from 1 to 10. Each of these 10 possibilities is equally likely. At the beginning of year 1, the potential market for the doll is two million. The potential market grows by an average of 4% per year. The company is 95% sure that the growth in the potential market during any year will be between 2.5% and 5.5%. It uses a normal distribution to model this. The company believes its share of the potential market during year 1 will be at worst 30%, most likely 50%, and at best 60%. It uses a triangular distribution to model this. The variable cost of producing a doll during year 1 has a triangular distribution with parameters 15, 17, and 20. The current selling price is 45. Each year, the variable cost of producing the doll will increase by an amount that is triangularly distributed with parameters 2.5%, 3%, and 3.5%. You can assume that once this change is generated, it will be the same for each year. You can also assume that the company will change its selling price by the same percentage each year. The fixed cost of developing the doll (which is incurred right away, at time 0) has a triangular distribution with parameters 5 million, 7.5 million, and 12 million. Right now there is one competitor in the market. During each year that begins with four or fewer competitors, there is a 25% chance that a new competitor will enter the market. Year t sales (for t 1) are determined as follows. Suppose that at the end of year t 1, n competitors are present (including Play Things). Then during year t, a fraction 0.9 0.1n of the company's loyal customers (last year's purchasers) will buy a doll from Play Things this year, and a fraction 0.2 0.04n of customers currently in the market ho did not purchase a doll last year will purchase a doll from Play Things this year. Adding these two provides the mean sales for this year. Then the actual sales this year is normally distributed with this mean and standard deviation equal to 7.5% of the mean. a. Use @RISK to estimate the expected NPV of this project. b. Use the percentiles in @ RISKs output to find an interval such that you are 95% certain that the companys actual NPV will be within this interval.The game of Chuck-a-Luck is played as follows: You pick a number between 1 and 6 and toss three dice. If your number does not appear, you lose 1. If your number appears x times, you win x. On the average, use simulation to find the average amount of money you will win or lose on each play of the game.A calculus instructor uses computer-aided instruction and allows students to take the midterm exam as many times as needed until a passing grade is obtained. Following is a record of the number of students in a class of 50 who took the test each number of times. Students Number of Tests 22 1 15 2 8 3 5 4 a.Find the expected value of the number of tests taken. b.Compute the variance and the standard deviation of the number of tests taken.
- A carpenter is making doors that are 2058 millimeters tall. If the doors are too long they must be trimmed, and if they are too short they cannot be used. A sample of 13 doors is made, and it is found that they have a mean of 2043 millimeters with a variance of 1024. Is there evidence at the 0.025 level that the doors are too short and unusable? State the null and alternative hypotheses for the above scenario.Hi is this correct?The management of an oil company is trying to decide whether to drill for oil in a particular fieldin the Gulf of Mexico. It costs the company $600 thousand to drill in the selected field. Themanagement believes that if oil is found in this field, its estimated value will be $3400 thousand. Atpresent, this oil company believes that there is a 45% chance that the selected field actually containsoil. Before drilling, the oil company can hire a team of geologists to perform seismographic tests at acost of $55 thousand. Based on similar tests in other fields, the tests have a 25% false negative rate(no oil predicted when oil is present) and a 15% false positive rate (oil predicted when no oil ispresent).A. Assume the oil company wants to maximize its expected net earnings. Please utilize decisiontree analysis to determine its optimal strategy.B. Calculate the expected value of the information (EVI/EVSI) provided by the team ofgeologists.C. Calculate and interpret EVPI…A manufacturer of programmable calculators is attempting to determine a reasonable free-service period for a model it will introduce shortly. The manager of product testing has indicated that the calculators have an expected life of 30 months. Assume product life can be described by an exponential distribution. T / MTBF e-T /MTBF T / MTBF e-T /MTBF T / MTBF e-T /MTBF 0.10 0.9048 2.60 0.0743 5.10 0.0061 0.20 0.8187 2.70 0.0672 5.20 0.0055 0.30 0.7408 2.80 0.0608 5.30 0.0050 0.40 0.6703 2.90 0.0550 5.40 0.0045 0.50 0.6065 3.00 0.0498 5.50 0.0041 0.60 0.5488 3.10 0.0450 5.60 0.0037 0.70 0.4966 3.20 0.0408 5.70 0.0033 0.80 0.4493 3.30 0.0369 5.80 0.0030 0.90 0.4066 3.40 0.0334 5.90 0.0027 1.00 0.3679 3.50 0.0302 6.00 0.0025 1.10 0.3329 3.60 0.0273 6.10 0.0022 1.20 0.3012 3.70 0.0247 6.20 0.0020 1.30 0.2725 3.80 0.0224 6.30 0.0018 1.40 0.2466 3.90 0.0202 6.40 0.0017 1.50 0.2231 4.00 0.0183 6.50 0.0015 1.60 0.2019 4.10 0.0166 6.60 0.0014 1.70 0.1827 4.20…
- Let’s suppose that you have a set of time-series variables, and you want to model the relationship between them. Read the situations given below and answer the questions. (200 words)a) Explain the statistical test if the linear combination (of time-series variables) is I(0).b) Which statistical test can be applied if all the series are integrated of the same order I(1). Justify your answerA metropolitan school system consists of three districts—north, south, and central. The north districtcontains 25% of all students, the south district contains 40%, and the central district contains35%. A minimum-competency test was given to all students; 10% of the north district studentsfailed, 15% of the south district students failed, and 5% of the central district students failed. What is the probability that a student selected at random failed the test?A firm has modeled its experience with industrial accidents and found that the number of accidents per year is related to the number of employees by the regression equation Y = 6.6 + 0.098*X. R-Square is 0.72. The regression is based on 20 annual observations. The firm intends to employ 480 workers next year. How many accidents do you project? 47.04 accidents 8.66 accidents 53.64 accidents 72% of the 480 workers 28.56 accidents