a. Complete the ANOVA table. (Round the MS- and F-values to 4 decimal places.) SOURCE DF SS Regression 100 Error Total 630 b. How large was the sample? n= c. Determine the standard error of estimate. (Round the final answer to 4 decimal places.) Se d. Determine the coefficient of determination. (Round the final answer to 2 decimal places.) ,2-
a. Complete the ANOVA table. (Round the MS- and F-values to 4 decimal places.) SOURCE DF SS Regression 100 Error Total 630 b. How large was the sample? n= c. Determine the standard error of estimate. (Round the final answer to 4 decimal places.) Se d. Determine the coefficient of determination. (Round the final answer to 2 decimal places.) ,2-

Practical Management Science
6th Edition
ISBN:9781337406659
Author:WINSTON, Wayne L.
Publisher:WINSTON, Wayne L.
Chapter2: Introduction To Spreadsheet Modeling
Section: Chapter Questions
Problem 20P: Julie James is opening a lemonade stand. She believes the fixed cost per week of running the stand...

Related questions
Question
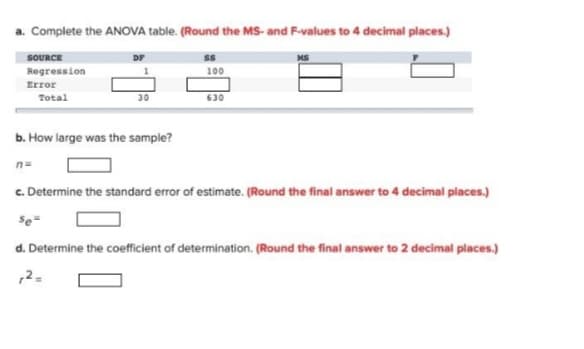
Transcribed Image Text:a. Complete the ANOVA table. (Round the MS- and F-values to 4 decimal places.)
SOURCE
Regression
100
Error
Total
30
630
b. How large was the sample?
n=
c. Determine the standard error of estimate. (Round the final answer to 4 decimal places.)
d. Determine the coefficient of determination. (Round the final answer to 2 decimal places.)
Expert Solution
This question has been solved!
Explore an expertly crafted, step-by-step solution for a thorough understanding of key concepts.

Step by step
Solved in 2 steps

Recommended textbooks for you
Practical Management Science
Operations Management
ISBN:
9781337406659
Author:
WINSTON, Wayne L.
Publisher:
Cengage,

Operations Management
Operations Management
ISBN:
9781259667473
Author:
William J Stevenson
Publisher:
McGraw-Hill Education

Operations and Supply Chain Management (Mcgraw-hi…
Operations Management
ISBN:
9781259666100
Author:
F. Robert Jacobs, Richard B Chase
Publisher:
McGraw-Hill Education
Practical Management Science
Operations Management
ISBN:
9781337406659
Author:
WINSTON, Wayne L.
Publisher:
Cengage,
Operations Management
Operations Management
ISBN:
9781259667473
Author:
William J Stevenson
Publisher:
McGraw-Hill Education
Operations and Supply Chain Management (Mcgraw-hi…
Operations Management
ISBN:
9781259666100
Author:
F. Robert Jacobs, Richard B Chase
Publisher:
McGraw-Hill Education


Purchasing and Supply Chain Management
Operations Management
ISBN:
9781285869681
Author:
Robert M. Monczka, Robert B. Handfield, Larry C. Giunipero, James L. Patterson
Publisher:
Cengage Learning

Production and Operations Analysis, Seventh Editi…
Operations Management
ISBN:
9781478623069
Author:
Steven Nahmias, Tava Lennon Olsen
Publisher:
Waveland Press, Inc.